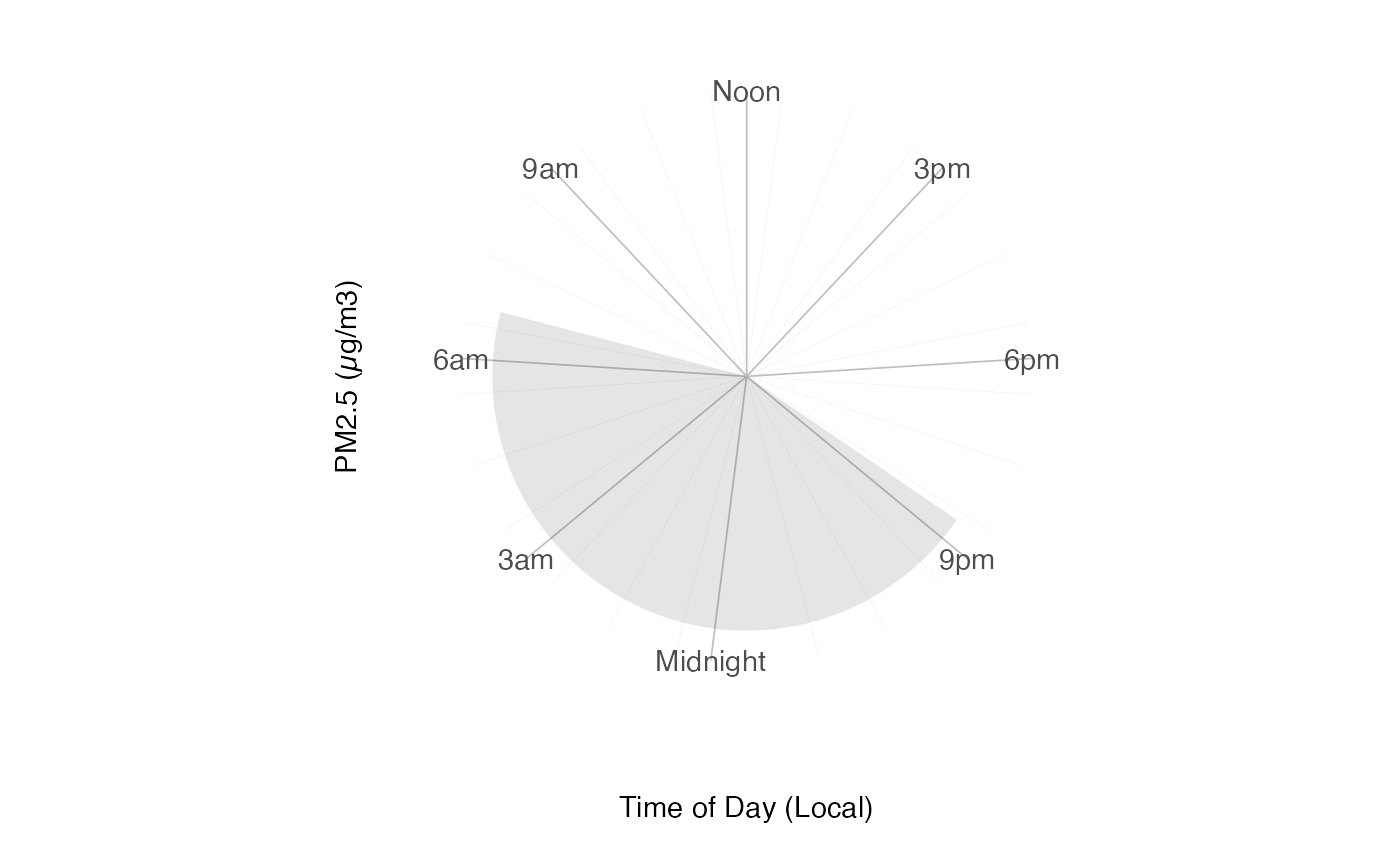
This function assembles various layers to create a production-ready "clock" plot for one monitor.
monitor_ggClockPlot(
  mts_monitor,
  startdate = NULL,
  enddate = NULL,
  deviceDeploymentID = NULL,
  timezone = NULL,
  ...
)
Arguments
| mts_monitor | A mts_monitor object. |
|---|---|
| startdate | Desired startdate for data to include, in a format that can be parsed with parseDatetime. |
| enddate | Desired enddate for data to include, in a format that can be parsed with parseDatetime. |
| deviceDeploymentID | deviceDeploymentID to include in the plot. |
| timezone | Timezone for x-axis scale. If NULL and only one timezone present in the data, the data timezone will be used. If NULL and multiple timezones present, the default is UTC. |
| ... | Additional arguments passed on to
|
Value
A ggplot object
Examples
mts_monitor <- AirMonitor::Carmel_Valley monitor_ggClockPlot(mts_monitor, startdate = 20160801, enddate = 20160810)#> Warning: Ignoring unknown aesthetics: input#> Warning: Computation failed in `stat_mean_by_group()`: #> object 'AQI' not foundif (FALSE) { mts_monitor <- airnow_loadLatest() monitor_ggClockPlot(mts_monitor, deviceDeploymentID = "8e3f0e62b2af8cd7_410432002") }