Apply a moving-window mean function to a numeric vector.
roll_mean(
  x,
  width = 1L,
  by = 1L,
  align = c("center", "left", "right"),
  na.rm = FALSE,
  weights = NULL
)
Arguments
- x
Numeric vector.
- width
Integer width of the rolling window.
- by
Integer shift by which the window is moved each iteration.
- align
Character position of the return value within the window. One of:
"left" | "center" | "right".- na.rm
Logical specifying whether
NAvalues should be removed before the calculations within each window.- weights
Numeric vector of length
widthspecifying each window index weight. IfNULL, unit weights are used.
Value
Numeric vector of the same length as x.
Details
For every index in the incoming vector x, a value is returned that
is the mean of all values in x that fall within a window of width
width.
The align parameter determines the alignment of the return value
within the window. Thus:
align = "left" [*------]will cause the returned vector to have width - 1NAvalues at the right end.align = "center" [---*---]will cause the returned vector to haveNAvalues at either end as needed for centered alignment.align = "right" [------*]will cause the returned vector to have width - 1NAvalues at the left end.
For large vectors, the by parameter can be used to force the window
to jump ahead by indices for the next calculation. Indices that are
skipped over will be assigned NA values so that the return vector still has
the same length as the incoming vector. This can dramatically speed up
calculations for high resolution time series data.
The roll_mean() function supports an additional weights
argument that can be used to calculate a weighted moving average,
a convolution of the incoming data with the kernel provided in weights.
Examples
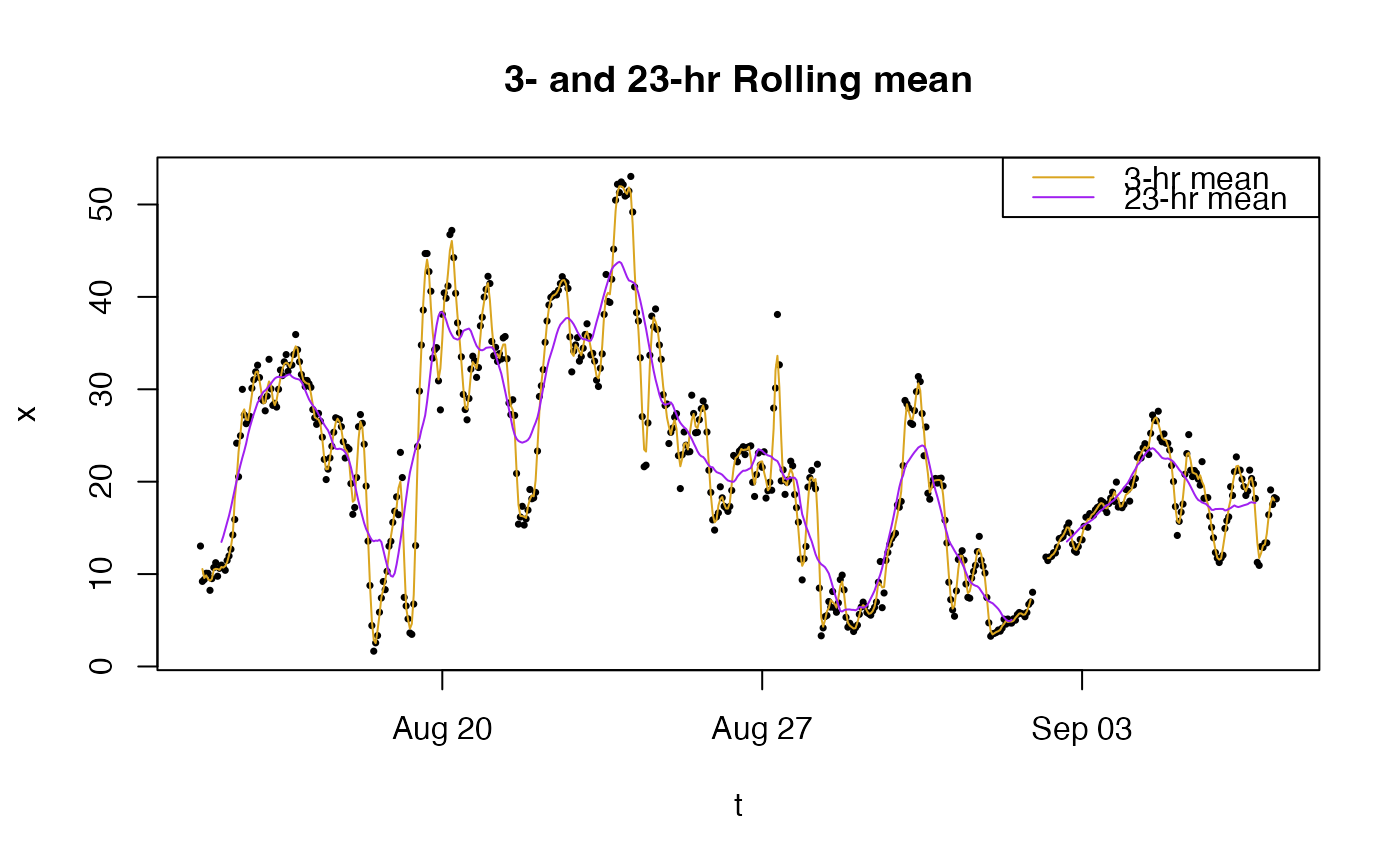
# Example air quality time series
t <- example_pm25$datetime
x <- example_pm25$pm25

plot(t, x, pch = 16, cex = 0.5)
lines(t, roll_mean(x, width = 3), col = "goldenrod")
lines(t, roll_mean(x, width = 23), col = "purple")
legend("topright", lty = c(1, 1),
       col = c("goldenrod", "purple"),
       legend = c("3-hr mean", "23-hr mean"))
title("3- and 23-hr Rolling mean")