Add a multi-sided polygon to a plot.
addWindBarbs(
  x,
  y,
  speed,
  dir,
  circleSize = 1,
  circleFill = "transparent",
  lineCol = 1,
  extraBarbLength = 0,
  barbSize = 1,
  ...
)
Arguments
| x | vector of longitudes |
|---|---|
| y | vector of latitudes |
| speed | vector of wind speeds in knots |
| dir | wind directions in degrees clockwise from north |
| circleSize | size of the circle |
| circleFill | circle fill color |
| lineCol | line color (currently not supported) |
| extraBarbLength | add length to barbs |
| barbSize | size of the barb |
| ... | additional arguments to be passed to |
References
https://commons.wikimedia.org/wiki/Wind_speed
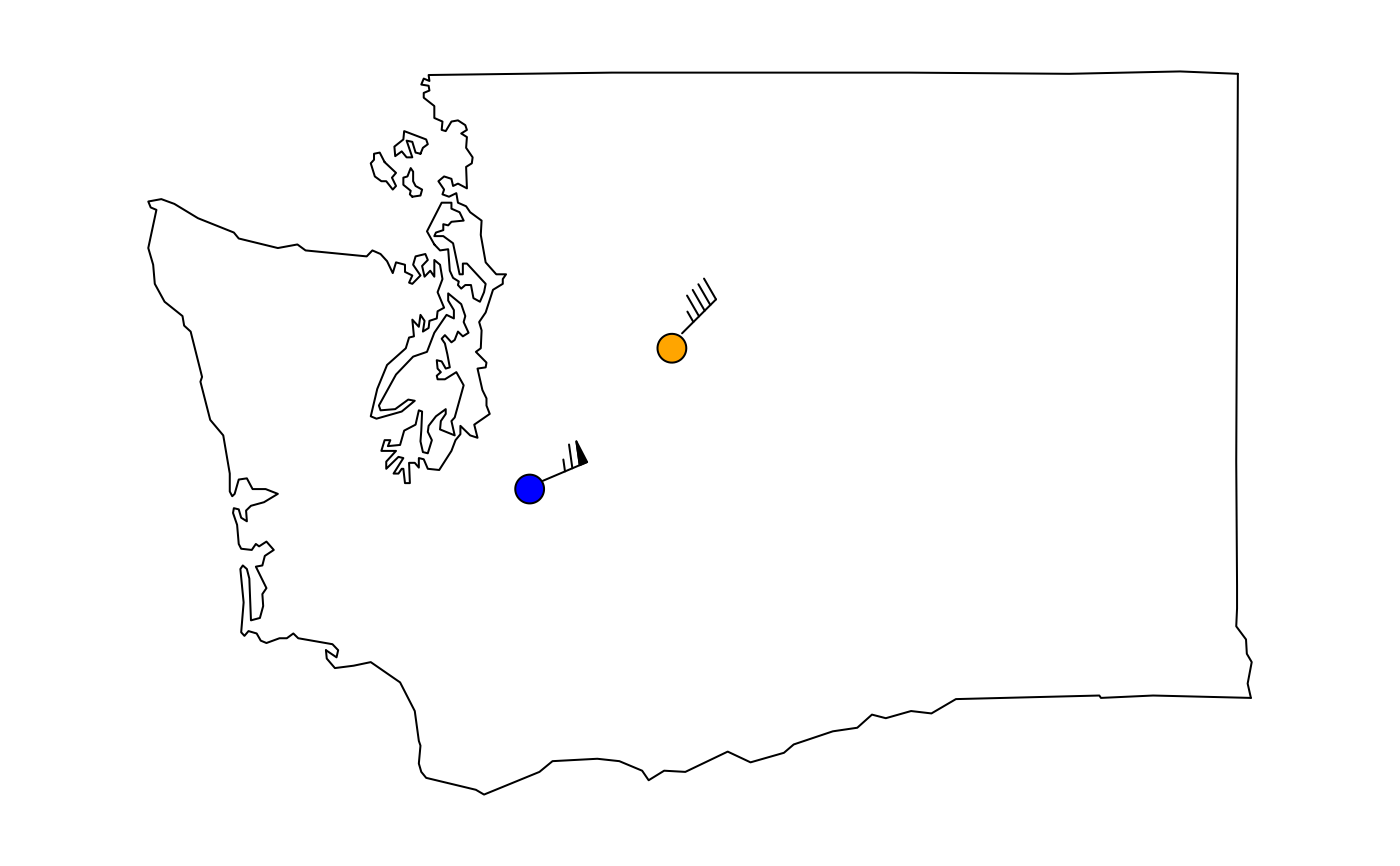
Examples
x <- c(-121, -122) y <- c(47.676057, 47) addWindBarbs(x, y, speed = c(45,65), dir = c(45, 67), circleSize = 1.8, circleFill = c('orange', 'blue'))