This function uses the leaflet::colorBin() function
to return a vector or matrix of colors derived from PM2.5 values.
aqiColors(
  x,
  palette = AQI$colors,
  domain = c(0, 1e+06),
  bins = AQI$breaks_24,
  na.color = NA
)
Arguments
| x | vector or matrix of PM2.5 values or a ws_monitor object |
|---|---|
| palette | color palette (see |
| domain | range of valid data (see |
| bins | color bins (see |
| na.color | missing value color (see |
Value
A vector or matrix of AQI colors to be used in maps and plots.
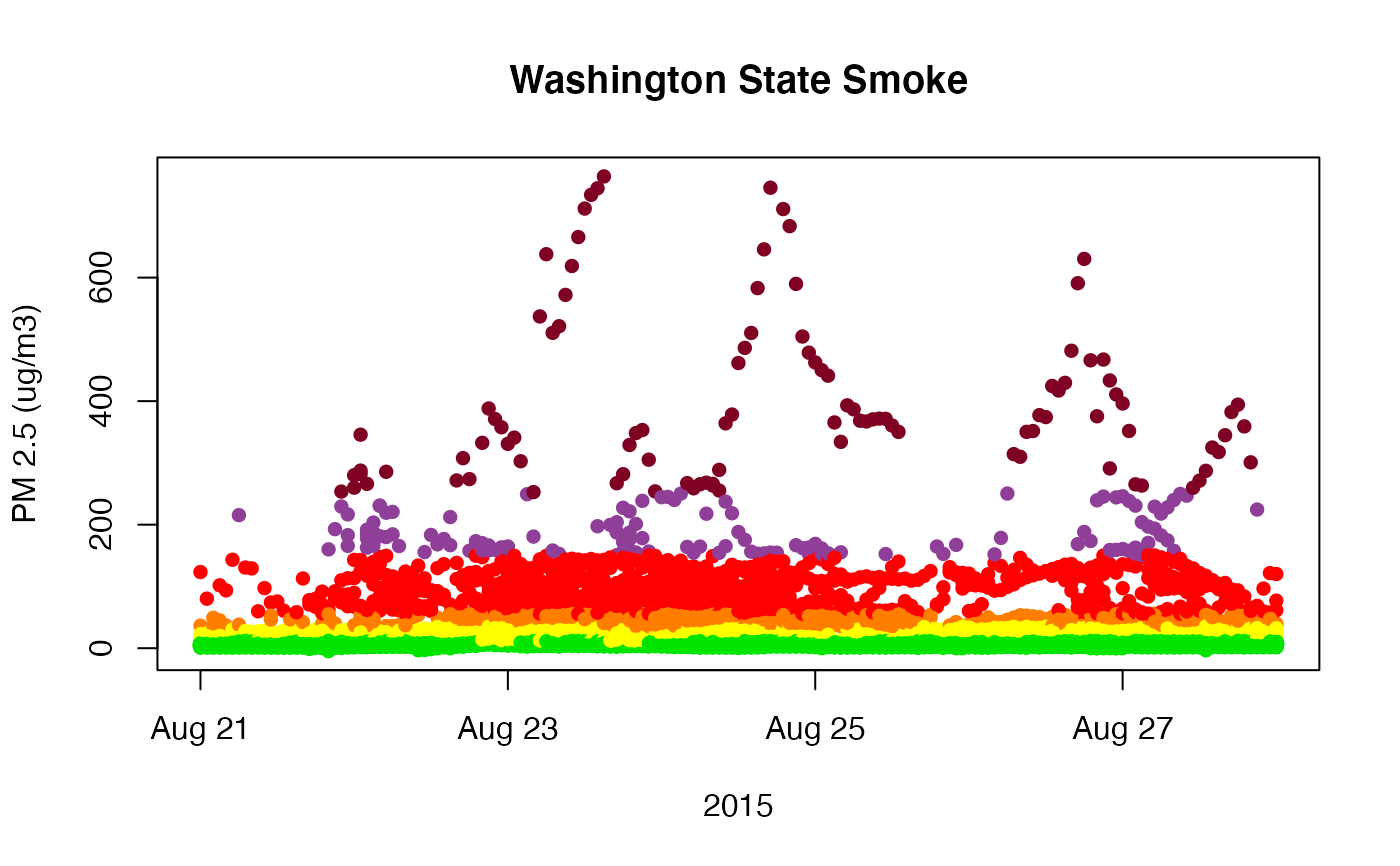
Examples
wa <- monitor_subset(Northwest_Megafires, stateCodes='WA', tlim=c(20150821,20150828)) colorMatrix <- aqiColors(wa) time <- wa$data$datetime pm25 <- wa$data[,-1] plot(time, pm25[,1], col=colorMatrix[,1], ylim=range(pm25, na.rm=TRUE), xlab="2015", ylab="PM 2.5 (ug/m3)", main="Washington State Smoke")