Creates a *leaflet* color palette function that can be used to convert monitoring data into vectors of colors.
aqiPalette(style = "aqi", reverse = FALSE)
Arguments
| style | Palette style, one of `aqi`. |
|---|---|
| reverse | Logicial specifying whether the colors (or color function) in palette should be used in reverse order. |
Value
A function that takes a single parameter x; when called with a vector of numbers, #RRGGBB color strings are returned.
See also
`leaflet::colorBin()`
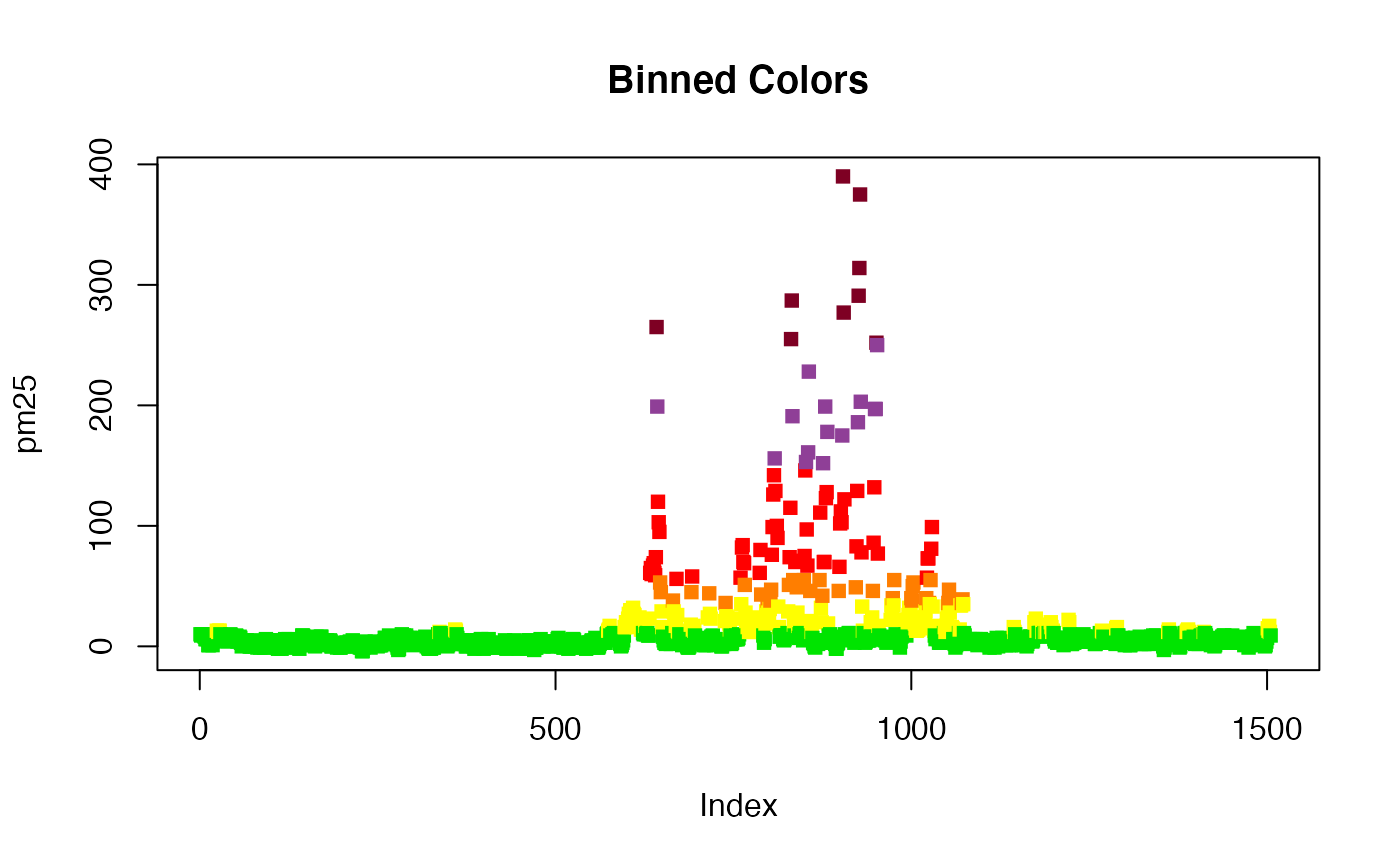
Examples
pm25 <- PWFSLSmoke::Carmel_Valley$data[,2]
binned_colors <- aqiPalette("aqi")(pm25)
plot(pm25, col=binned_colors, pch=15, main='Binned Colors')