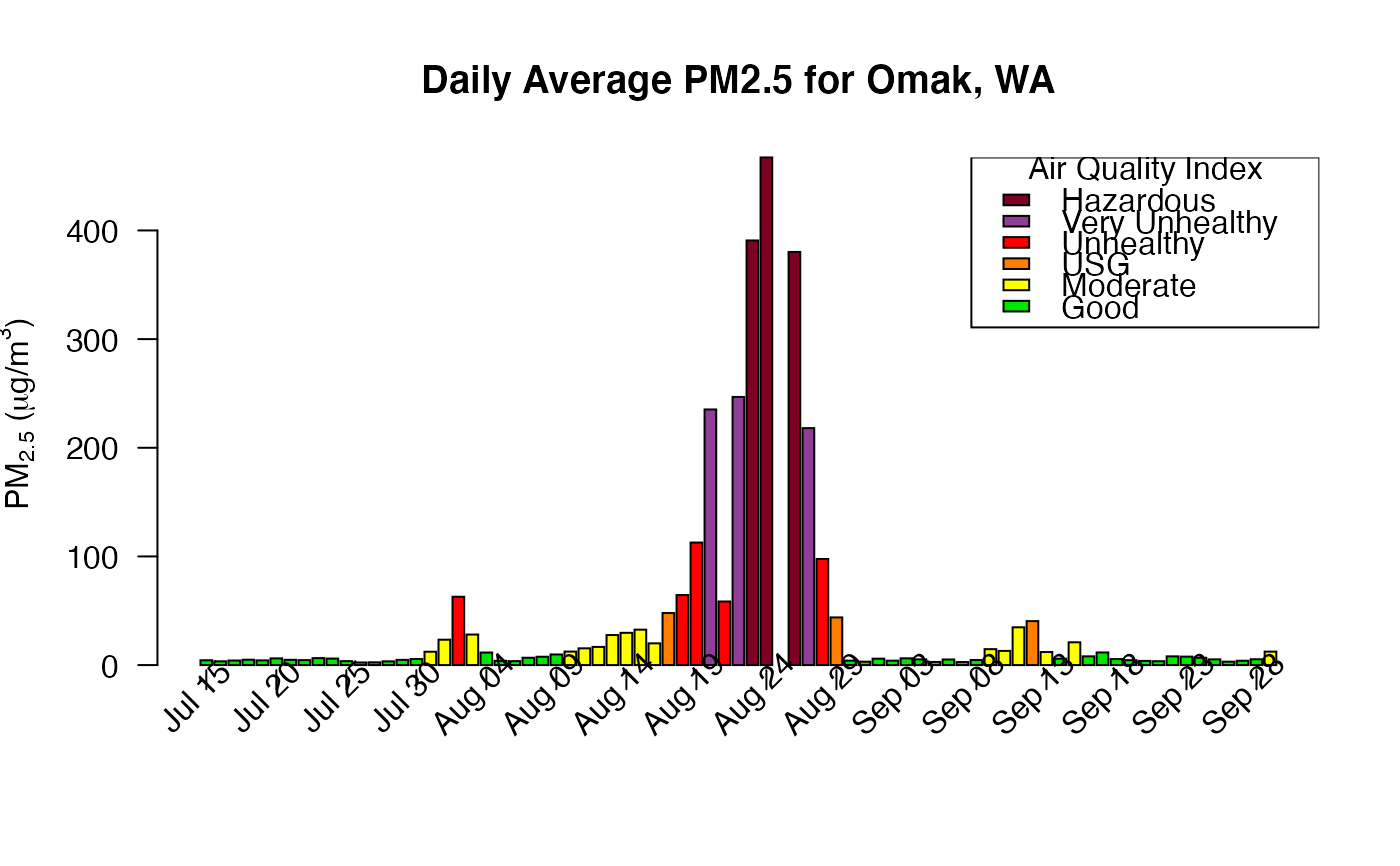
Creates a bar plot showing daily average PM 2.5 values for a specific monitor in a ws_monitor object. Each bar is colored according to its AQI category.
This function is a wrapper around base::barplot and any arguments to
that function may be used.
Each 'day' is the midnight-to-midnight period in the monitor local timezone.
When tlim is used, it is converted to the monitor local timezone.
monitor_dailyBarplot(
  ws_monitor,
  monitorID = NULL,
  tlim = NULL,
  minHours = 18,
  gridPos = "",
  gridCol = "black",
  gridLwd = 0.5,
  gridLty = "solid",
  labels_x_nudge = 0,
  labels_y_nudge = 0,
  ...
)
Arguments
| ws_monitor | ws_monitor object |
|---|---|
| monitorID | monitor ID for a specific monitor in |
| tlim | optional vector with start and end times (integer or character
representing YYYYMMDD[HH] or |
| minHours | minimum number of valid data hours required to calculate each daily average |
| gridPos | position of grid lines either 'over', 'under' ('' for no grid lines) |
| gridCol | color of grid lines (see graphical parameter 'col') |
| gridLwd | line width of grid lines (see graphical parameter 'lwd') |
| gridLty | type of grid lines (see graphical parameter 'lty') |
| labels_x_nudge | nudge x labels to the left |
| labels_y_nudge | nudge y labels down |
| ... | additional arguments to be passed to |
Details
The labels_x_nudge and labels_y_nudge can be used to tweak the
date labeling. Units used are the same as those in the plot.
Examples
library(PWFSLSmoke) N_M <- monitor_subset(Northwest_Megafires, tlim = c(20150715, 20150930)) main <- "Daily Average PM2.5 for Omak, WA" monitor_dailyBarplot(N_M, monitorID = "530470013_01", main = main, labels_x_nudge = 1)
