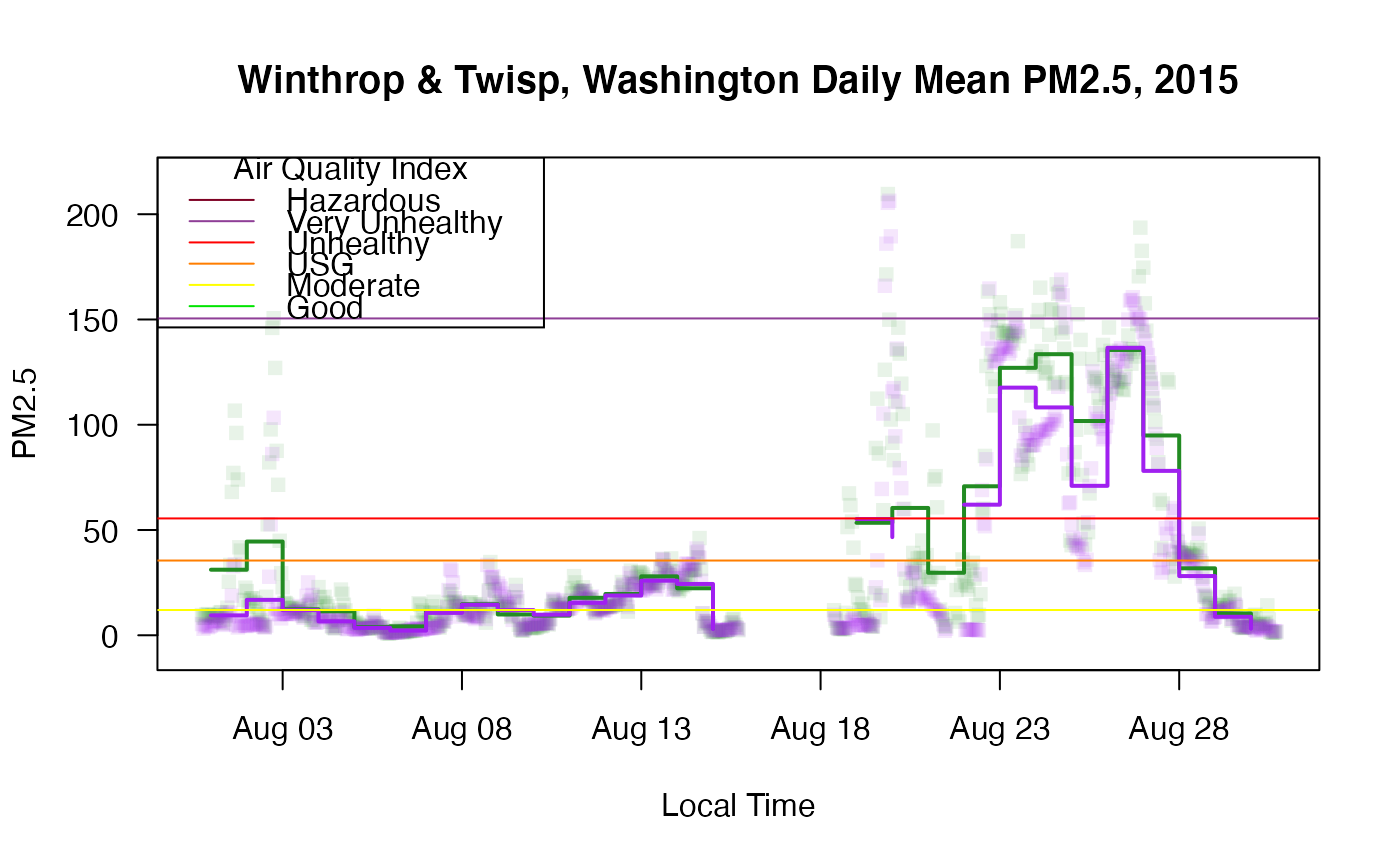
Calculates daily statistics for each monitor in ws_monitor.
monitor_dailyStatistic(
  ws_monitor,
  FUN = get("mean"),
  dayStart = "midnight",
  na.rm = TRUE,
  minHours = 18
)
Arguments
| ws_monitor | ws_monitor object |
|---|---|
| FUN | function used to collapse a day's worth of data into a single number for each monitor in the ws_monitor object |
| dayStart | one of |
| na.rm | logical value indicating whether NA values should be ignored |
| minHours | minimum number of valid data hours required to calculate each daily statistic |
Value
A ws_monitor object with daily statistics for the local timezone.
Details
Sunrise and sunset times are calculated based on the first monitor encountered. This should be accurate enough for all use cases involving co-located monitors. Monitors from different regions should have daily statistics calculated separately.
Note
Note that the incoming ws_monitor object should have UTC (GMT) times and that this function calculates daily statistics based on local (clock) time. If you choose a date range based on UTC times this may result in an insufficient number of hours in the first and last daily records of the returned ws_monitor object.
The returned ws_monitor object has a daily time axis where each
datetime is set to the beginning of each day, 00:00:00, local time.
Examples
# \donttest{ N_M <- monitor_subset(Northwest_Megafires, tlim=c(20150801,20150831)) WinthropID <- '530470010_01' TwispID <- '530470009_01' MethowValley <- monitor_subset(N_M, tlim=c(20150801,20150831), monitorIDs=c(WinthropID,TwispID)) MethowValley_dailyMean <- monitor_dailyStatistic(MethowValley, FUN=get('mean'), dayStart='midnight') # Get the full Y scale monitor_timeseriesPlot(MethowValley, style='gnats', col='transparent')monitor_timeseriesPlot(MethowValley_dailyMean, monitorID=TwispID, type='s', lwd=2, col='forestgreen', add=TRUE)monitor_timeseriesPlot(MethowValley_dailyMean, monitorID=WinthropID, type='s', lwd=2, col='purple', add=TRUE)# }
