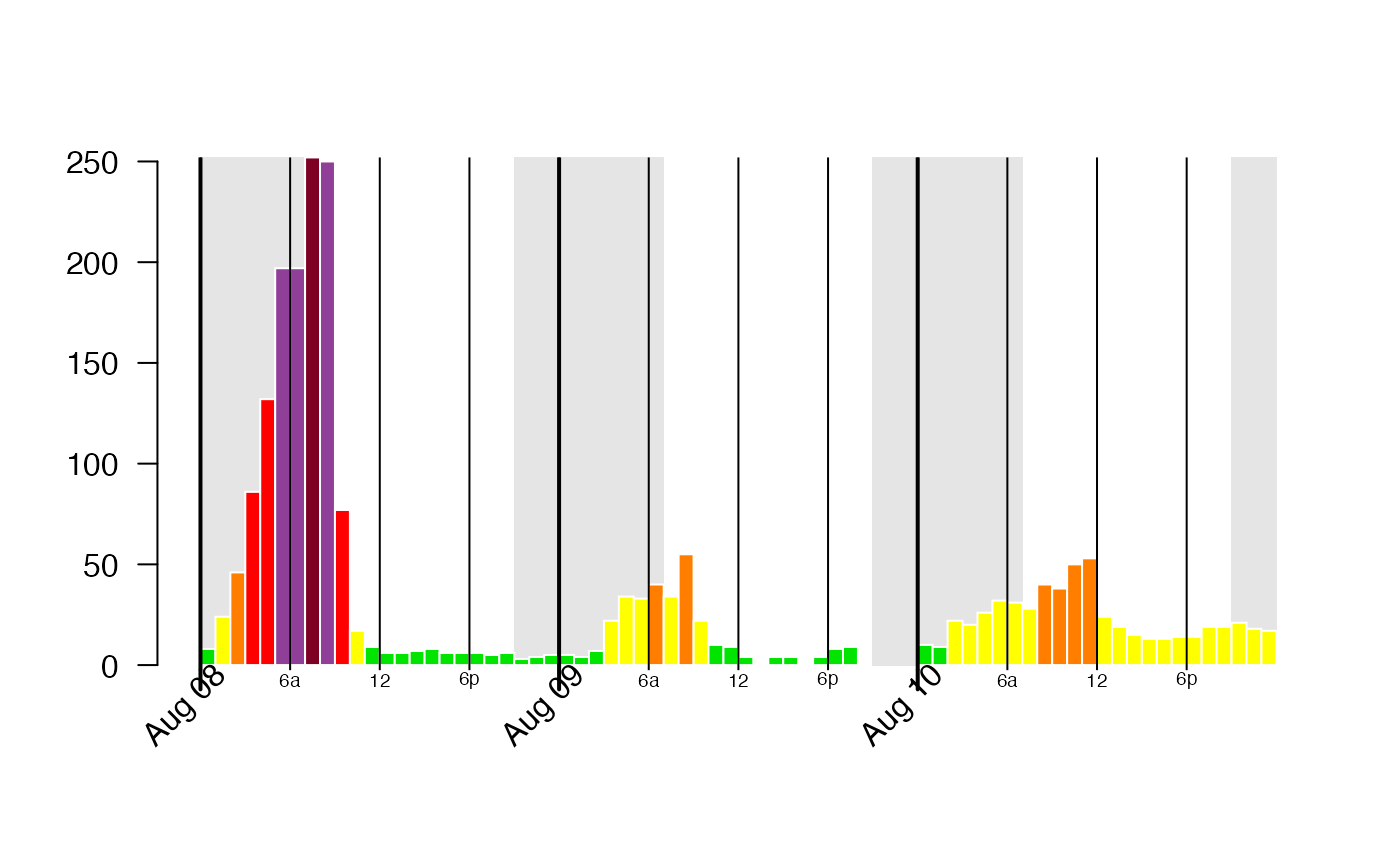
Creates a bar plot showing hourly PM 2.5 values for a specific monitor in a ws_monitor object. Colors are assigned to one of the following styles:
AQI-- hourly values colored with AQI colors using AQI 24-hour breaksbrownScaleAQI-- hourly values colored with brownscale colors using AQI 24-hour breaksgrayScaleAQI-- hourly values colored grayscale colors using AQI 24-hour breaks
monitor_hourlyBarplot(
  ws_monitor,
  monitorID = NULL,
  tlim = NULL,
  localTime = TRUE,
  style = "AQI",
  shadedNight = TRUE,
  gridPos = "",
  gridCol = "black",
  gridLwd = 0.5,
  gridLty = "solid",
  labels_x_nudge = 0,
  labels_y_nudge = 0,
  dayCol = "black",
  dayLwd = 2,
  dayLty = "solid",
  hourCol = "black",
  hourLwd = 1,
  hourLty = "solid",
  hourInterval = 6,
  ...
)
Arguments
| ws_monitor | ws_monitor object |
|---|---|
| monitorID | monitor ID for a specific monitor in |
| tlim | optional vector with start and end times (integer or character representing YYYYMMDD[HH]) |
| localTime | logical specifying whether |
| style | named style specification ('AirFire') |
| shadedNight | add nighttime shading |
| gridPos | position of grid lines either 'over', 'under' ("" for no grid lines) |
| gridCol | grid color |
| gridLwd | grid line width |
| gridLty | grid line type |
| labels_x_nudge | nudge x labels to the left |
| labels_y_nudge | nudge y labels down |
| dayCol | day boundary color |
| dayLwd | day boundary line width (set to 0 to omit day lines) |
| dayLty | day boundary type |
| hourCol | hour boundary color |
| hourLwd | hour boundary line width (set to 0 to omit hour lines) |
| hourLty | hour boundary type |
| hourInterval | interval for hour boundary lines |
| ... | additional arguments to be passed to |
Details
The labels_x_nudge and labels_y_nudge can be used to
tweak the date labeling. Units used are the same as those in the plot.
Examples
library(PWFSLSmoke)

C_V <- monitor_subset(Carmel_Valley, tlim = c(2016080800,2016081023),
                      timezone = "America/Los_Angeles")

monitor_hourlyBarplot(C_V, main = "1-Hourly Average PM2.5",
                      labels_x_nudge = 1, labels_y_nudge = 0)
