Calculates rolling means for each monitor in ws_monitor using the
openair::rollingMean() function
monitor_rollingMean(ws_monitor, width = 8, data.thresh = 75, align = "center")
Arguments
| ws_monitor | ws_monitor object |
|---|---|
| width | number of periods to average (e.g. for hourly data, |
| data.thresh | minimum number of valid observations required as a percent of |
| align | alignment of averaging window relative to point being calculated; one of |
Value
A ws_monitor object with data thaty have been processed by a rolling mean algorithm.
Details
align = 'left': Forward roll, using hour of interest and the (width-1) subsequent hours (e.g. 3-hr left-aligned roll for Hr 5 will consist of average of Hrs 5, 6 and 7)align = 'right': Backwards roll, using hour of interest and the (width-1) prior hours (e.g. 3-hr right-aligned roll for Hr 5 will consist of average of Hrs 3, 4 and 5)align = 'center'for oddwidth: Average of hour of interest and (width-1)/2 on either side (e.g. 3-hr center-aligned roll for Hr 5 will consist of average of Hrs 4, 5 and 6)align = 'center'for evenwidth: Average of hour of interest and (width/2)-1 hours prior andwidth/2 hours after (e.g. 4-hr center-aligned roll for Hr 5 will consist of average of Hrs 4, 5, 6 and 7)
Examples
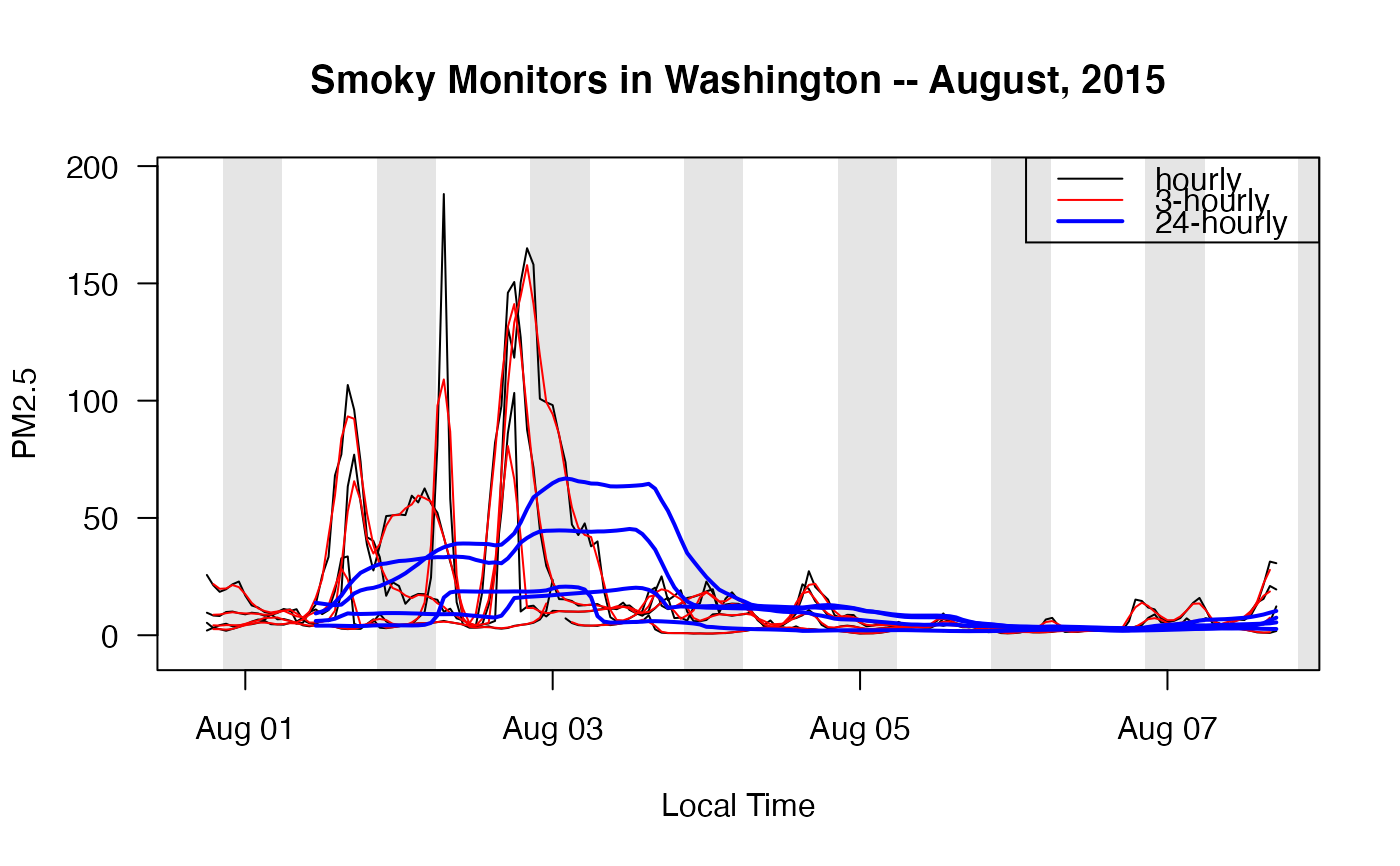
library(PWFSLSmoke) N_M <- Northwest_Megafires wa_smoky <- monitor_subset(N_M, stateCodes='WA', tlim=c(20150801, 20150808), vlim=c(100,Inf)) wa_smoky_3hr <- monitor_rollingMean(wa_smoky, width=3, align="center") wa_smoky_24hr <- monitor_rollingMean(wa_smoky, width=24, align="right") monitor_timeseriesPlot(wa_smoky, type='l', shadedNight=TRUE)
