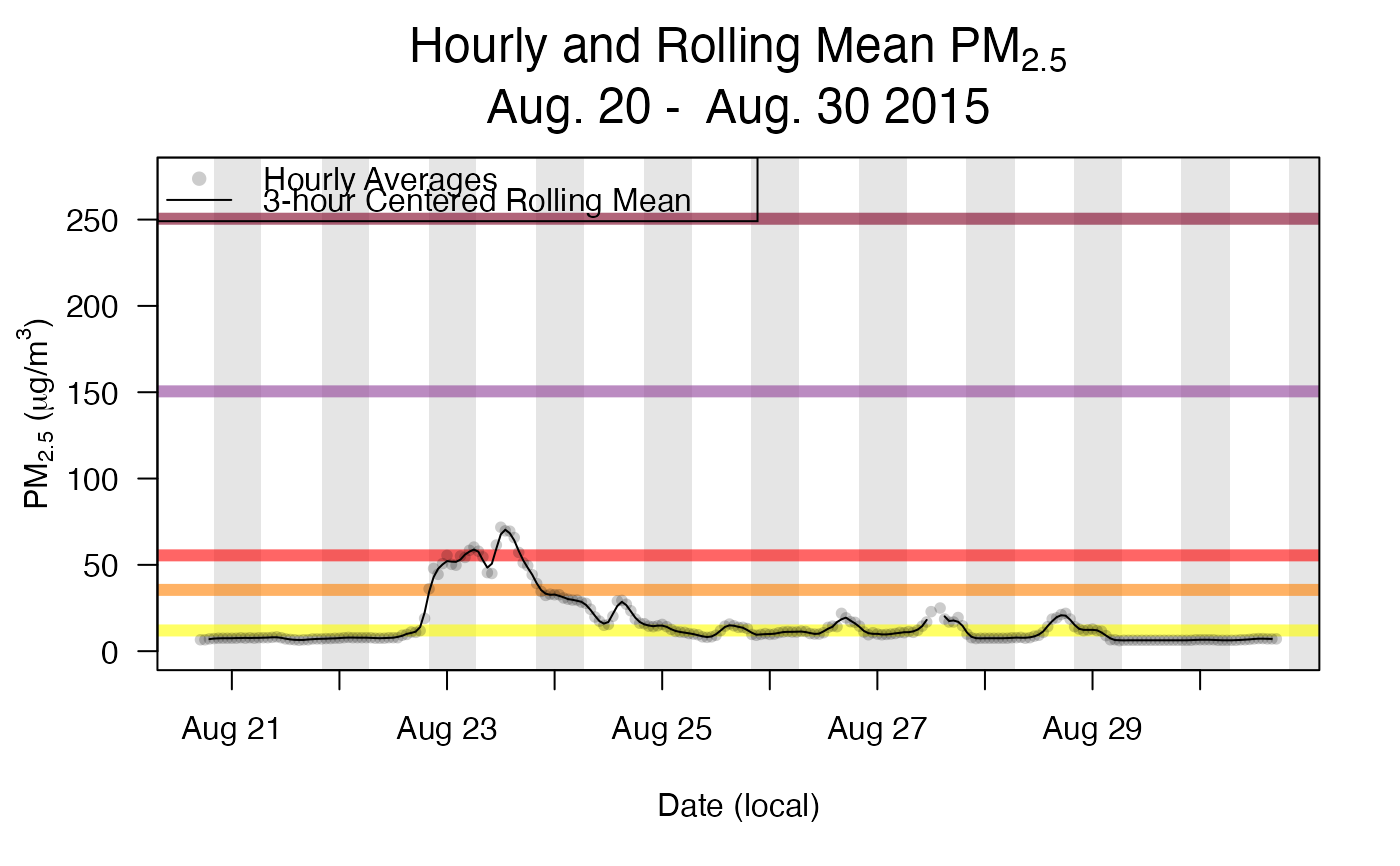
Creates a plot of individual (e.g. hourly) and rolling mean PM2.5 values for a specific monitor.
monitor_rollingMeanPlot(
  ws_monitor,
  monitorID = NULL,
  width = 3,
  align = "center",
  data.thresh = 75,
  tlim = NULL,
  ylim = NULL,
  localTime = TRUE,
  shadedNight = FALSE,
  aqiLines = TRUE,
  gridHorizontal = FALSE,
  grid24hr = FALSE,
  grid3hr = FALSE,
  showLegend = TRUE
)
Arguments
| ws_monitor | ws_monitor object |
|---|---|
| monitorID | Monitor ID for a specific monitor in the ws_monitor object (optional if only one monitor in the ws_monitor object). |
| width | Number of periods to average (e.g. for hourly data, |
| align | Alignment of averaging window relative to point being
calculated; one of |
| data.thresh | Minimum number of valid observations required as a percent
of |
| tlim | Optional vector with start and end times (integer or character representing YYYYMMDD[HH]). |
| ylim | y limits for the plot. |
| localTime | Logical specifying whether |
| shadedNight | Add nighttime shading. |
| aqiLines | Horizontal lines indicating AQI levels. |
| gridHorizontal | Add dashed horizontal grid lines. |
| grid24hr | Add dashed grid lines at day boundaries. |
| grid3hr | Add dashed grid lines every 3 hours. |
| showLegend | Include legend in top left. |
Details
align = "left": Forward roll, using hour of interest and the (width-1) subsequent hours (e.g. 3-hr left-aligned roll for Hr 5 will consist of average of Hrs 5, 6 and 7)align = "right": Backwards roll, using hour of interest and the (width-1) prior hours (e.g. 3-hr right-aligned roll for Hr 5 will consist of average of Hrs 3, 4 and 5)align = "center"for oddwidth: Average of hour of interest and (width-1)/2 on either side (e.g. 3-hr center-aligned roll for Hr 5 will consist of average of Hrs 4, 5 and 6)align = "center"for evenwidth: Average of hour of interest and (width/2)-1 hours prior andwidth/2 hours after (e.g. 4-hr center-aligned roll for Hr 5 will consist of average of Hrs 4, 5, 6 and 7)
Note
This function attempts to provide a 'publication ready' rolling mean plot.
Examples
library(PWFSLSmoke)

N_M <- Northwest_Megafires
Roseburg <- monitor_subset(N_M, tlim = c(20150821, 20150831),
                           monitorIDs = c("410190002_01"))
monitor_rollingMeanPlot(Roseburg, shadedNight = TRUE)
