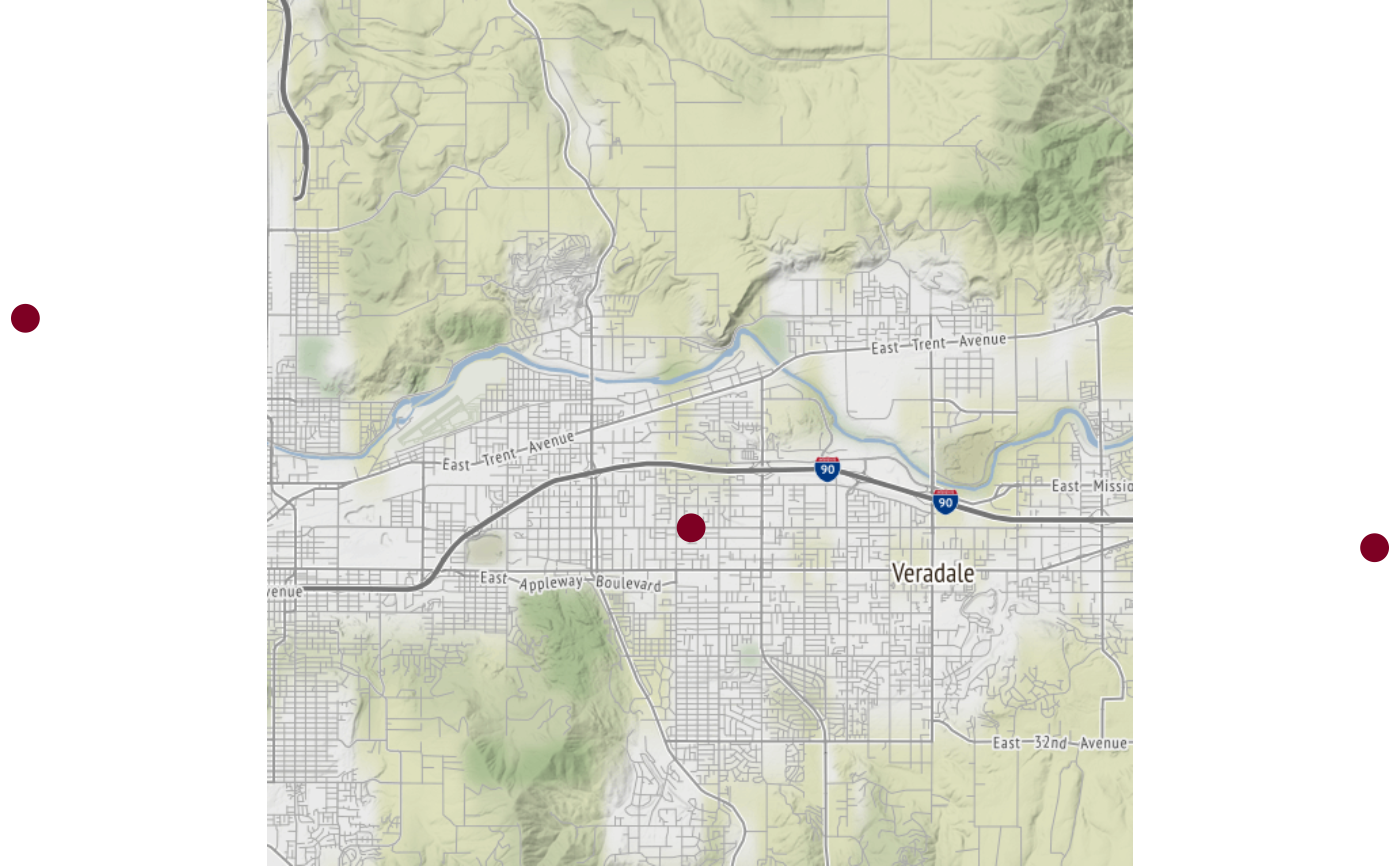
Plots a map showing ws_monitor locations and values.
See staticmap_getRasterBrick for a list of available
maptype options.
If centerLon, centerMap or zoom are not specified,
appropriate values will be calcualted using data from the
ws_monitor$meta dataframe.
monitor_staticmap(
  ws_monitor,
  slice = get("max"),
  breaks = AQI$breaks_24,
  colors = AQI$colors,
  width = 640,
  height = 640,
  centerLon = NULL,
  centerLat = NULL,
  zoom = NULL,
  maptype = "terrain",
  grayscale = FALSE,
  rasterBrick = NULL,
  cex = par("cex") * 2,
  pch = 16,
  ...
)
Arguments
| ws_monitor | ws_monitor object |
|---|---|
| slice | either a time index or a function used to collapse the time
axis -- defautls to |
| breaks | set of breaks used to assign colors |
| colors | a set of colors for different levels of air quality data
determined by |
| width | width of image, in pixels |
| height | height of image, in pixels |
| centerLon | map center longitude |
| centerLat | map center latitude |
| zoom | map zoom level |
| maptype | map type |
| grayscale | logical, if TRUE the colored map tile is rendered into a black & white image |
| rasterBrick | optional RGB rasterBrick object returned from
|
| cex | character expansion for points |
| pch | plotting character for points |
| ... | arguments passed on to |
Value
A plot with a basemap and colored dots for each monitor.
See also
Examples
# \donttest{ # Fail gracefully if any resources are not available try({ library(PWFSLSmoke) N_M <- Northwest_Megafires # monitor_leaflet(N_M) # to identify Spokane monitorIDs Spokane <- monitor_subsetBy(N_M, stringr::str_detect(N_M$meta$monitorID,'^53063')) Spokane <- monitor_subset(Spokane, tlim=c(20150815, 20150831)) monitor_staticmap(Spokane) }, silent = FALSE)# }