Introduction to MazamaSatelliteUtils
Mazama Science
12/16/2019
intro_to_mazama_satellite_utils.RmdThe MazamaSatelliteUtils R package is intended to facilitate working with GOES 16 and 17 Aerosol Optical Depth (AOD) data provided by NOAA and available through The U.S. Forest Service AirFire Research Team data site. The package is designed to allow easy access to AOD data and provides a host of features to analyze and visualize the data.
Intended users of this package are researchers of wildfire smoke or anyone interested in studying the effects of aerosols in the atmosphere. It is released under GPL and is available from Github.
MazamaSatelliteUtils requires that the R programming language be installed, as well as the following R packages.
- sp
- MazamaSpatialUtils
These, and the MazamaSatelliteUtils package itself, can be installed from The Comprehensive R Archive Network (CRAN).
install.packages('MazamaSatelliteUtils').
Developers and people interested in working with the very latest version of the code can install it directly from Github.
devtools::install_github('mazamascience/MazamaSatelliteUtils').
Introduction to GOES AOD Data
GOES 16 & 17
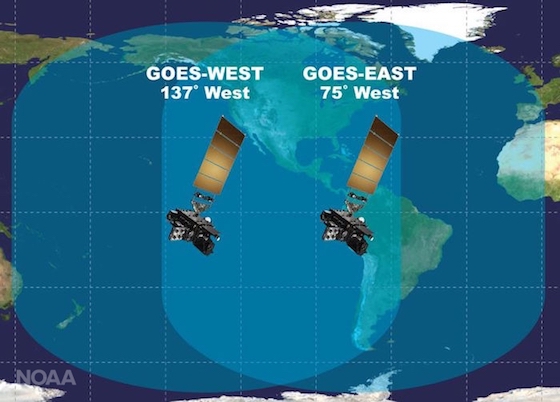
The MazamaSatelliteUtils package uses data provided by the Advanced Baseline Imager (ABI) on board the Geostationary Operational Environmental Satellites (GOES) 16 and 17. GOES 16 and 17 are also known as “GOES-East” and “GOES-West” respectively due to the difference in their positioning relative to the surface of the Earth. GOES-16 (East) is positioned over the Equator at a geographic longitude of -75 deg, roughly equal to Dover, DE, and is intended to provide good imaging of the Eastern half of the United States. GOES-17 (West) is also positioned over the Equator at -137 deg, roughly halfway between Los Angeles and Honolulu, and is intended to cover the Western half of the U.S..
The ABI imager on GOES satellites operates in a variety of scanning modes which capture data at different intervals. The AOD data used by MazamaSatelliteUtils is obtained by scanning the full extent of the Contiguous U.S. (CONUS) every five minutes. The measurements of each individual scan are saved to a NetCDF file for that particular period in time. Other data sets produced by the GOES satellites, include:
- “Full Disk” imagery that includes Alaska, Central America and S. America
- Cloud and Moisture Imagery
- Fire/Hot Spot Characterization
- Land Surface Temperature
- Rainfall Rate
- Sea Surface Temperature
- Snow Cover
* See the GOES-RSeriesDataBook.pdf and the ABI AOD algorithm theoretical basis document for additional detail on available GOES products.
AOD
Aerosol Optical Depth (AOD) is a measure of the number of particles (aerosols) in the air. Aerosols scatter and absorb incoming sunlight, which reduces visibility. AOD indicates the degree to which they prevent light from traveling through the atmosphere. For an observer on the ground, a low AOD value indicates “clean” air, which is characterized by clear blue sky, bright sun and maximum visibility. When AOD levels increase, aerosols can become so dense that the sun is obscured.
There are to limitations where AOD values can be calculated. AOD is only available over areas with clear-sky (cloud-free) pixels. Additionally, AOD is not calculated over “bright” land surfaces. This means that most non-vegetated, or sparsely vegetated desert areas, snow or ice-covered surfaces and water surface in sun-glint do not have AOD values. Finally, areas where the solar zenith angle is larger than 80 deg and/or the satellite zenith angle is larger than 60 deg reduces the quality of the AOD calculations. This is discussed more in the section below on DQF and data quality.
An AOD value is a measure of columnar extinction (scattering + absorption) of radiation by aerosols. It is proportional to the amount (number or mass concentration) of aerosols in an atmospheric column. AOD is unitless, but the valid range produced by the GOES sensor is from -0.05 to +5.00. Values closer to 0.0 correspond to a cleaner atmosphere while higher values correspond to more hazy conditions. An average AOD for the U.S. is usually around 0.1 to 0.15. Generally speaking, an AOD of less than 0.1 is “clean” and greater than 3.0 is “extremely hazy”.
DQF
In addition to AOD, MazamaSatelliteUtils uses the Data Quality Flag (DQF) to provide the user with an indication of AOD data quality. The DQF is a separate variable associated with each AOD data point and has 4 possible quality levels.
- 0 - high quality
- 1 - medium quality
- 2 - low quality
- 3 - no-retrieval (of quality metric)
DQF is affected by numerous factors, but a few of the most significant are:
- Sun angle
- Satellite zenith angle
- Bright land surface (presence of snow, ice or sand)
- Clouds
Several of these factors vary by season (clouds and snow) and by time of day (sun angle) but the satellite zenith angle is a geographic effect that cannot be altered. Depending on where in the Contiguous United States an AOD pixel is located, it may be impossible to obtain a high-quality DQF value. This is discussed in greater detail in the “GOES-East Data Quality Spatial Limits” document.