Create a nativeGrid object
goesaodc_createNativeGrid.RdCreates a nativeGrid object with a list of list of 2-D arrays for: lon, lat, AOD, and DQF. The arrays are defined in native i, j coordinates and are thus curvilinear as opposed to rectilinear geospatial coordinates.s
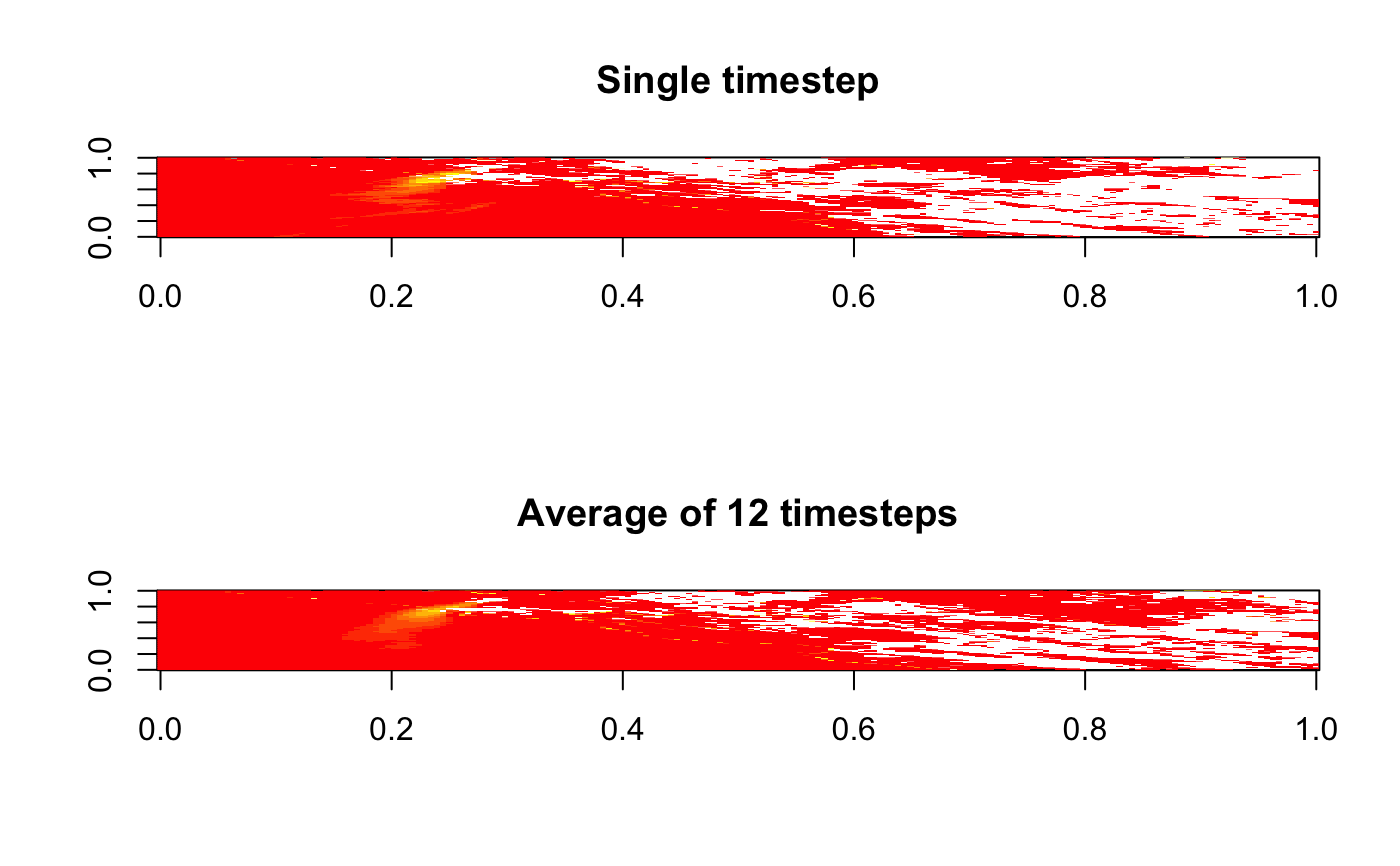
The nc parameter can be either a single netcdf handle or a list
of handles. If a list of handles is provided, grid cell values for AOD and
DQF will be averaged across all nc handles. This "native grid" averaging
provides a simple way to convert 5-minute data into an hourly average.
goesaodc_createNativeGrid(nc = NULL, bbox = bbox_CONUS, verbose = FALSE)
Arguments
| nc | ncdf4 handle or a list of handles. |
|---|---|
| bbox | Geographic extent of area of interest; Defaults to CONUS. |
| verbose | Logical flag to increase messages while processing data. |
Value
List with lon, lat, AOD and DQF arrays.
Examples
# \donttest{ # Process full extent of Gridfile library(MazamaSatelliteUtils) setSatelliteDataDir("~/Data/Satellite") goesaodc_downloadAOD( satID = "G17", datetime = "2019-10-27 14:00", timezone = "America/Los_Angeles" ) files <- goesaodc_listFiles("G17", "2019-10-27 14:00", timezone = "America/Los_Angeles") ncList <- list() for ( file in files ) { label <- file %>% goesaodc_convertFilenameToDatetime() %>% MazamaCoreUtils::timeStamp(unit = "sec", timezone = "UTC") ncList[[label]] <- goesaodc_openFile(basename(file)) } kincade_bbox <- c(-124, -120, 36, 39) layout(matrix(seq(2))) nativeGrid <- goesaodc_createNativeGrid(ncList[1], kincade_bbox) image(nativeGrid$AOD[,ncol(nativeGrid$AOD):1]) title("Single timestep") nativeGrid <- goesaodc_createNativeGrid(ncList, kincade_bbox) image(nativeGrid$AOD[,ncol(nativeGrid$AOD):1])title("Average of 12 timesteps")
