Introduction to AirMonitorPlots
Jonathan Callahan
October 11, 2023
Source:vignettes/AirMonitorPlots.Rmd
AirMonitorPlots.RmdInstallation
Install from CRAN with:
install.packages('AirMonitorPlots')
Install the latest version from GitHub with:
devtools::install_github('mazamascience/AirMonitorPlots')
Background
The AirMonitorPlots package provides plotting functionality to create production-ready plots for air quality monitoring data. It is designed to work with the AirMonitor package, integrating the data with ggplot2 plotting functions. High-level plotting functions make it easy for users to create beautiful plots of monitoring data. Since these functions are built on ggplot2, users familiar with ggplot2 can easily use the functions in this package to create custom plots.
Examples
The following examples use example mts_monitor objects from the AirMonitor package.
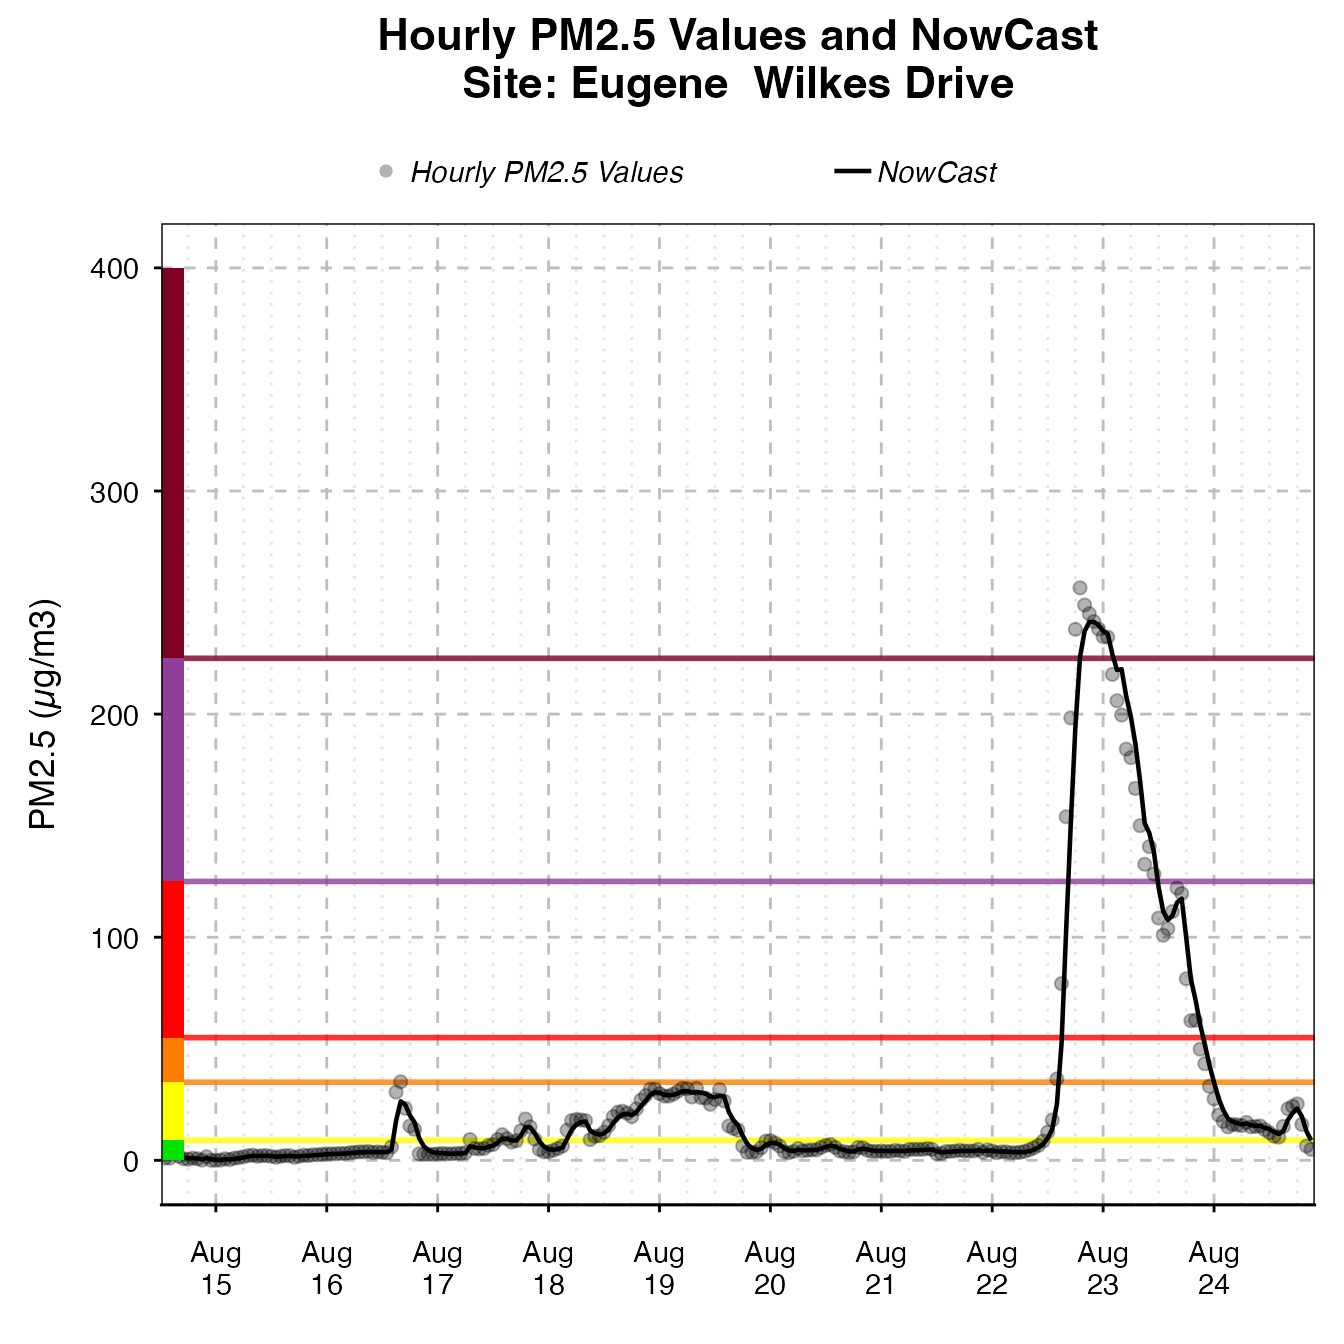
Timeseries
The default Timeseries plot is optimized for one
monitor.
library(AirMonitor)
library(AirMonitorPlots)

monitor_ggTimeseries(
  AirMonitor::NW_Megafires,
  startdate = 20150815,
  enddate = 20150825,
  id = "753019dc7f401908_410390101_03"
)
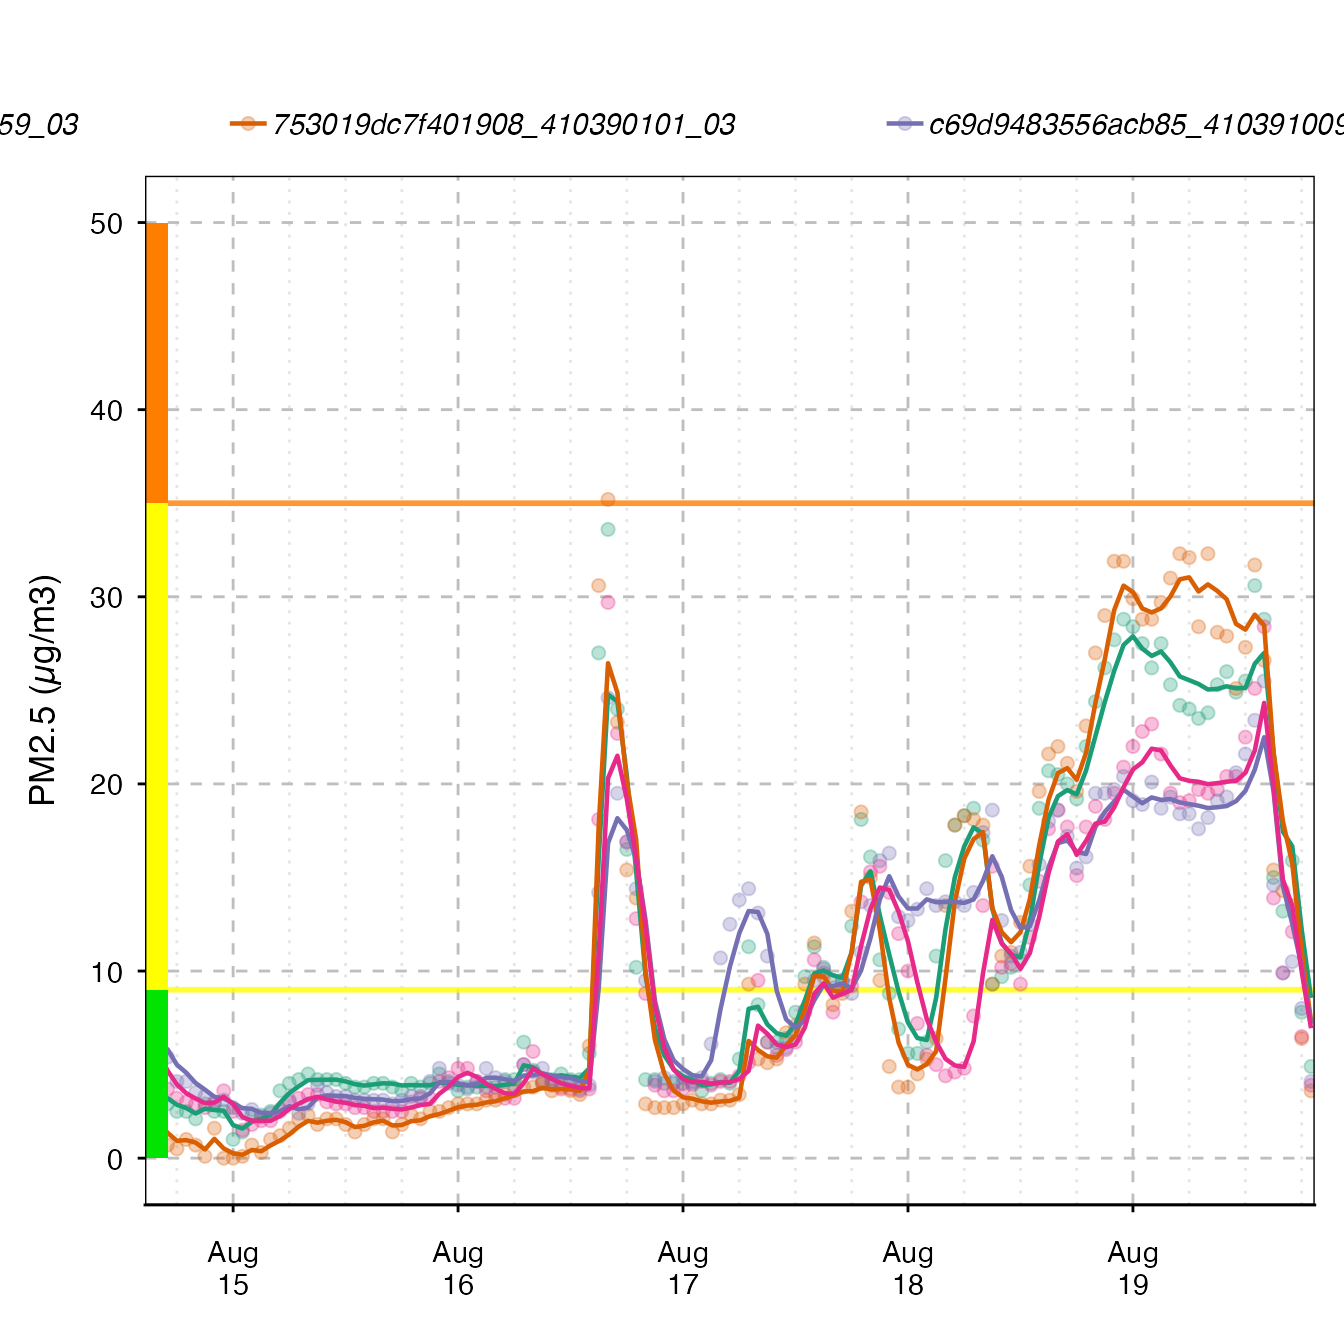
If more than one monitor is present, color will be mapped to deviceDeploymentID.
monitor_ggTimeseries(
  AirMonitor::NW_Megafires,
  startdate = 20150815,
  enddate = 20150820,
  id = c(
    "753019dc7f401908_410390101_03",
    "3d1ac393596c511a_410390059_03",
    "c69d9483556acb85_410391009_03",
    "eba98496f2495d0f_410390060_03"
  )
)
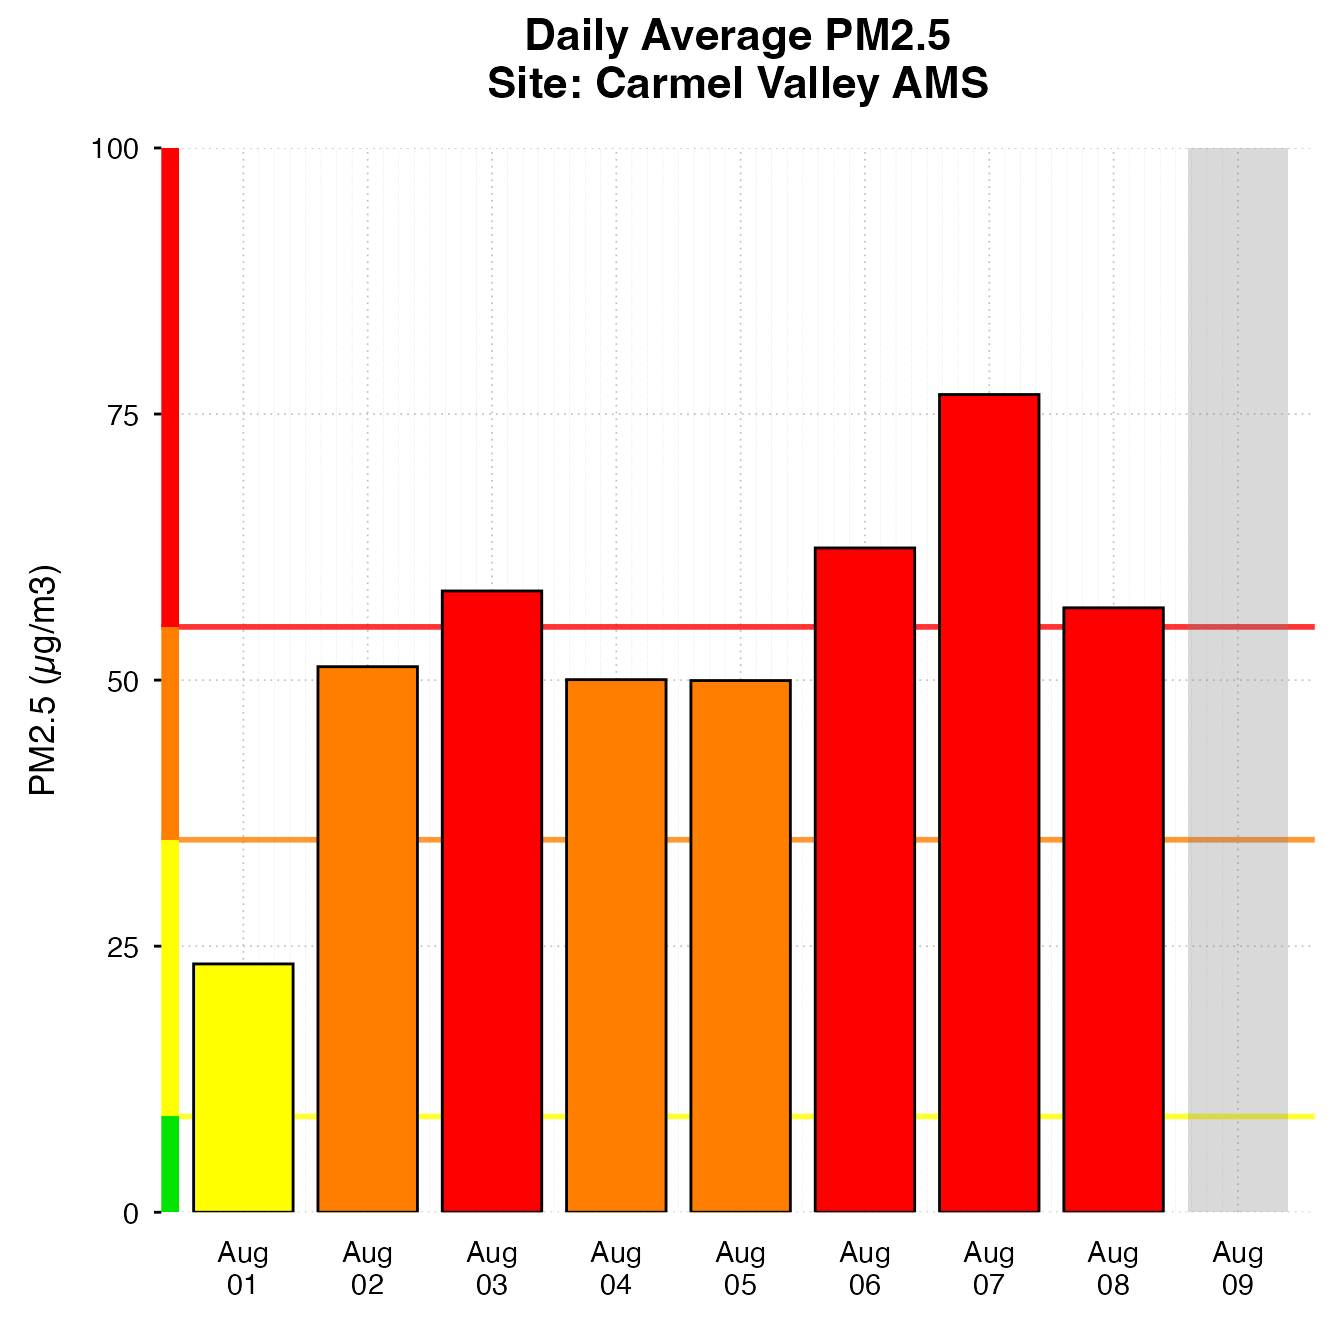
Daily Barplot
The DailyBarplot shows daily averages for one
monitor.
monitor_ggDailyBarplot(
  AirMonitor::Carmel_Valley,
  startdate = 20160801,
  enddate = 20160808
)
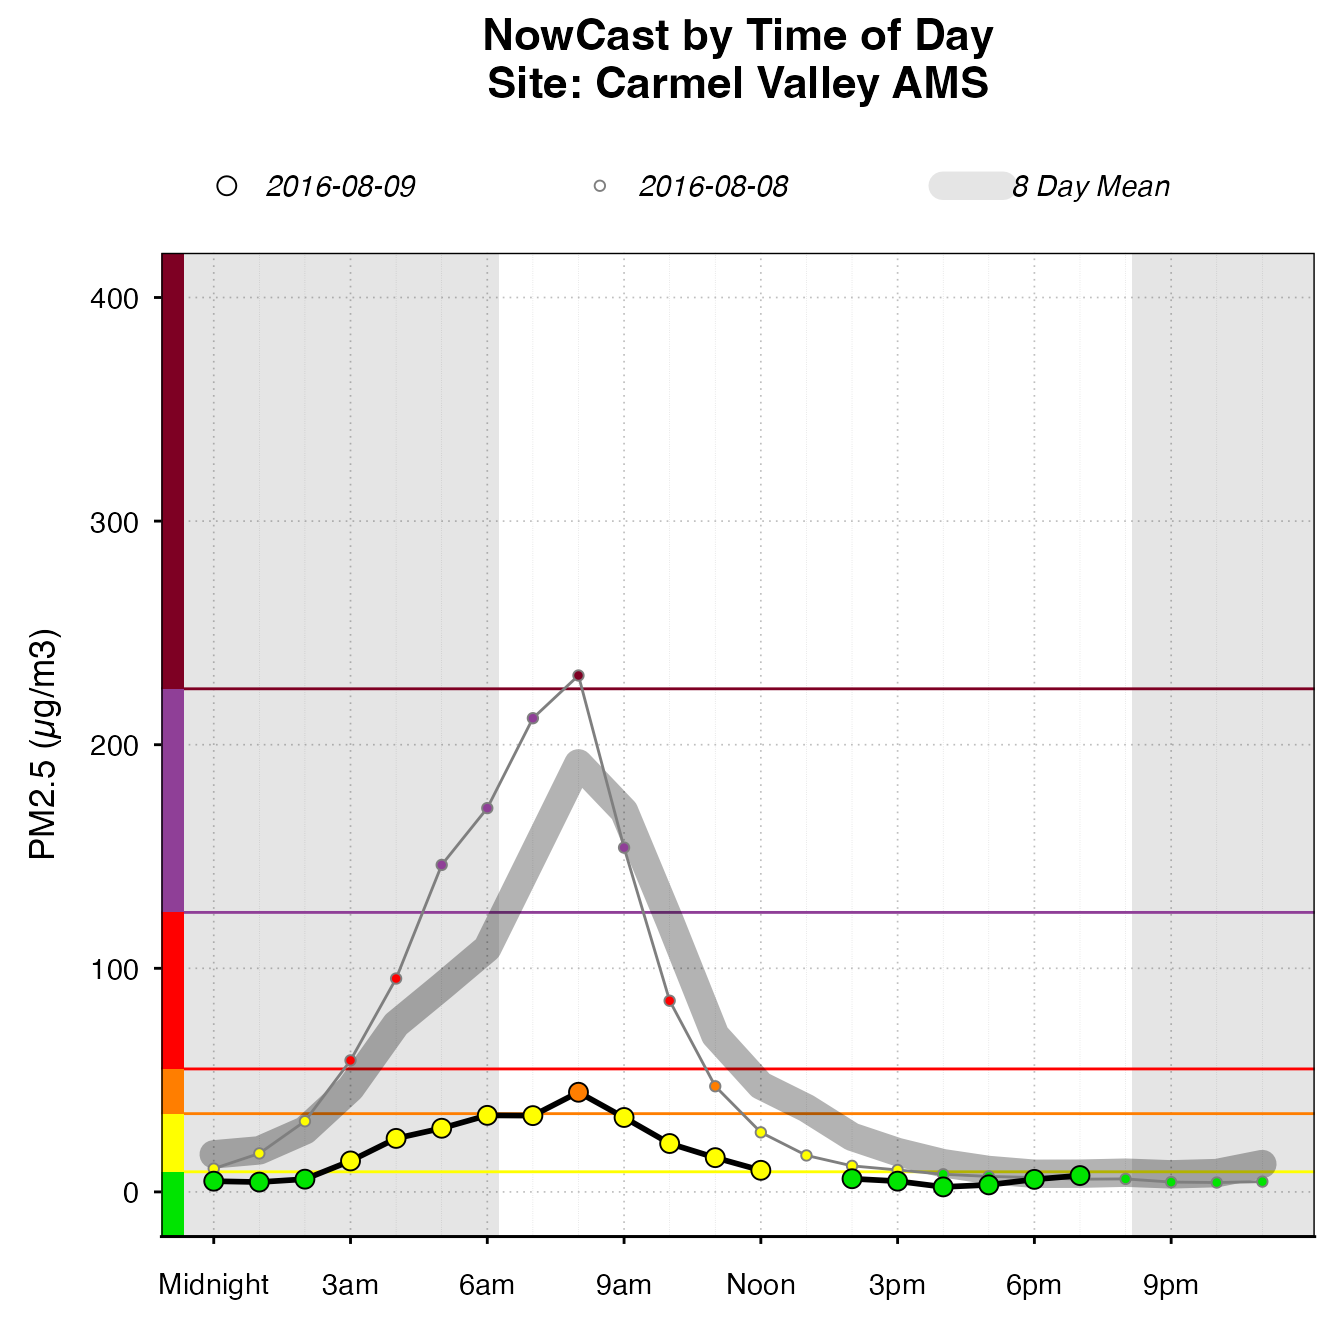
Daily By Hour
The dailyByHour is designed specifically to show current
data, with special lines for “today” and “yesterday”. However, it can
plot historical data, in which case enddate will be styled
as “today”.
monitor_ggDailyByHour(
  AirMonitor::Carmel_Valley,
  startdate = 20160801,
  enddate = 20160809
)