Adds AQ category stacked bars to a plot.
custom_aqiStackedBar(width = 0.02, position = "identity", ...)Arguments
Value
A ggplot plot object with AQ category annotations.
Examples
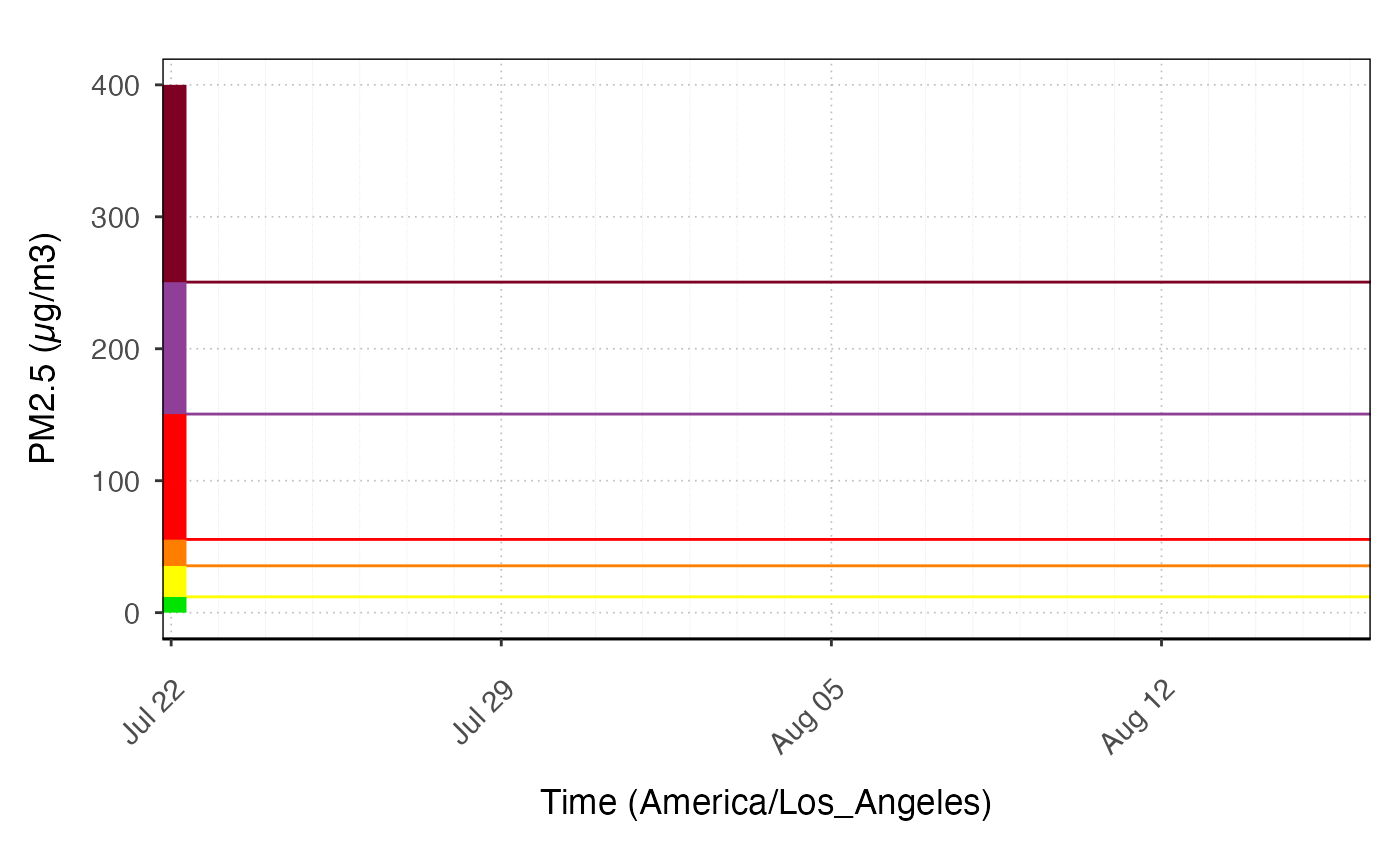
library (AirMonitorPlots)

AirMonitor::Carmel_Valley %>%
  ggplot_pm25Timeseries() +
  custom_aqiLines() +
  custom_aqiStackedBar()
#> Warning: The following aesthetics were dropped during statistical transformation: x and
#> y.
#> ℹ This can happen when ggplot fails to infer the correct grouping structure in
#>   the data.
#> ℹ Did you forget to specify a `group` aesthetic or to convert a numerical
#>   variable into a factor?