Create an archival daily barplot for one or more monitors
Source:R/monitor_ggDailyBarplot_archival.R
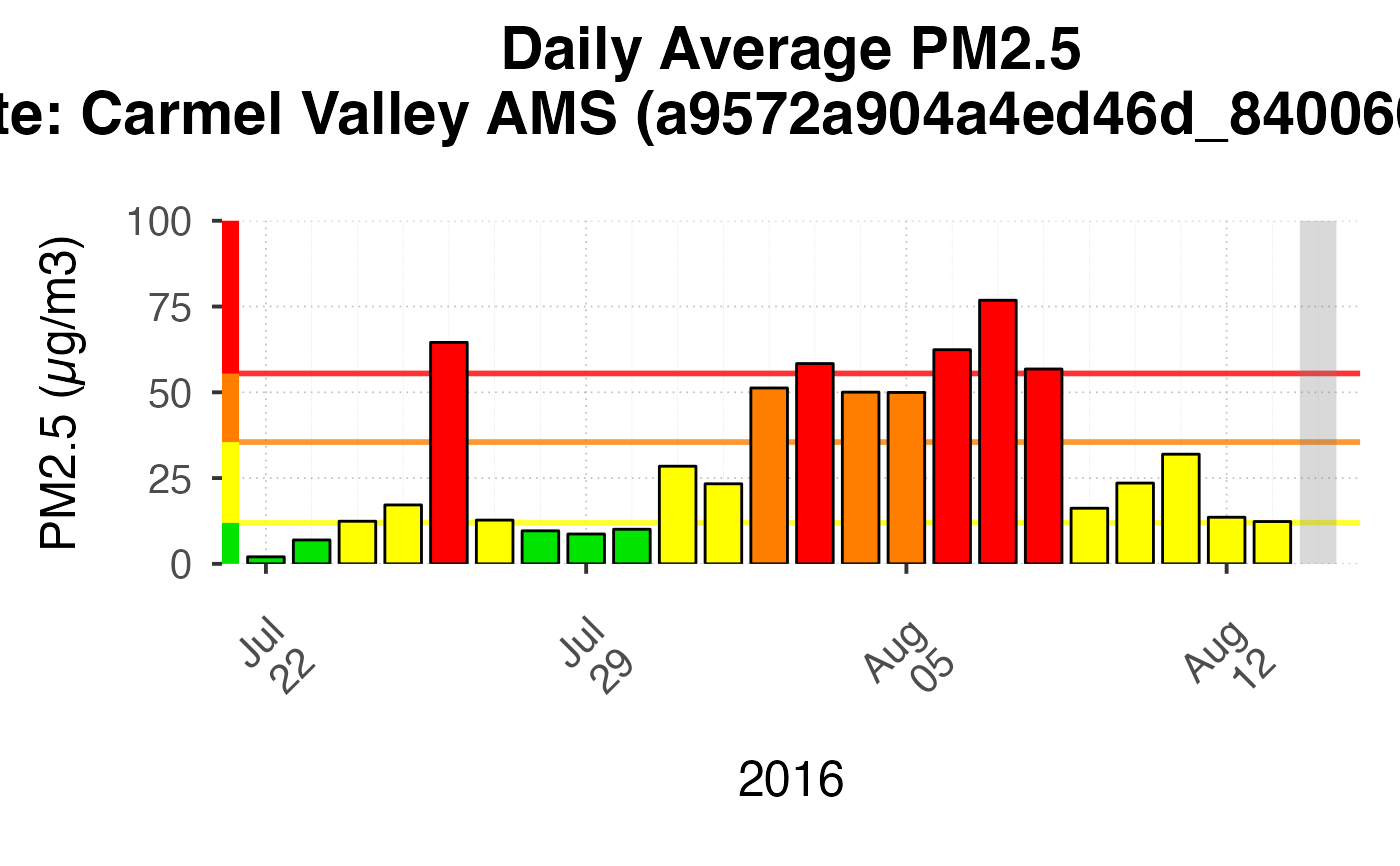
monitor_ggDailyBarplot_archival.RdThis function assembles various layers to create a production-ready archival daily barplot for one or more monitors.
The full range of data in monitor will be used unless both
startdate and enddate are specified.
monitor_ggDailyBarplot_archival(
  monitor,
  startdate = NULL,
  enddate = NULL,
  id = NULL,
  style = c("large", "small"),
  title = NULL,
  timezone = NULL,
  today = TRUE,
  ...
)
Arguments
- monitor
A mts_monitor object.
- startdate
Desired start date (integer or character in ymd format or POSIXct).
- enddate
Desired end date (integer or character in ymd format or POSIXct).
- id
deviceDeploymentID to include in the plot. This can be NULL if
monitoronly has one unique deviceDeploymentID.- style
String indicating plotting style. Either
"large"or"small".style = "large"is suitable for plots larger than 450x450px, and"small"is suitable for plots 450x450px or smaller.- title
Plot title. If NULL, a suitable title will be constructed.
- timezone
Olson timezone name for x-axis scale and date parsing. If NULL the timezone of the specified monitor will be used.
- today
Logical indicating whether to include a shaded "current NowCast" bar for Today. Ignored if data is not current.
- ...
Arguments passed onto
ggplot_pm25Timeseries.
Value
A ggplot object
Examples
library(AirMonitorPlots)

AirMonitor::Carmel_Valley %>%
  AirMonitor::monitor_trimDate() %>%
  monitor_ggDailyBarplot_archival()
#> Scale for y is already present.
#> Adding another scale for y, which will replace the existing scale.
#> Warning: The following aesthetics were dropped during statistical transformation: x and
#> y.
#> ℹ This can happen when ggplot fails to infer the correct grouping structure in
#>   the data.
#> ℹ Did you forget to specify a `group` aesthetic or to convert a numerical
#>   variable into a factor?