Create an archival timeseries plot for one or more monitors
Source:R/monitor_ggTimeseries_archival.R
monitor_ggTimeseries_archival.RdThis function assembles various layers to create a production-ready archival timeseries plot for one or more monitors.
monitor_ggTimeseries_archival(
  monitor,
  startdate = NULL,
  enddate = NULL,
  id = NULL,
  style = c("large", "small"),
  title = NULL,
  timezone = NULL,
  ...
)
Arguments
- monitor
A mts_monitor object.
- startdate
Desired start date (integer or character in ymd format or POSIXct).
- enddate
Desired end date (integer or character in ymd format or POSIXct).
- id
vector of deviceDeploymentIDs to include in the plot. If more than one, different monitors will be plotted in different colors.
- style
Plot style.
smallorlarge.style = smallis appropriate for plots 450x450px or smaller;style = largeis appropriate for plots larger than 450x450px.- title
Plot title. If NULL, a suitable title will be constructed.
- timezone
Olson timezone name for x-axis scale and date parsing. If NULL the timezone of the specified monitor will be used.
- ...
Arguments passed onto
ggplot_pm25Timeseries.
Value
A ggplot object.
Examples
library(AirMonitorPlots)

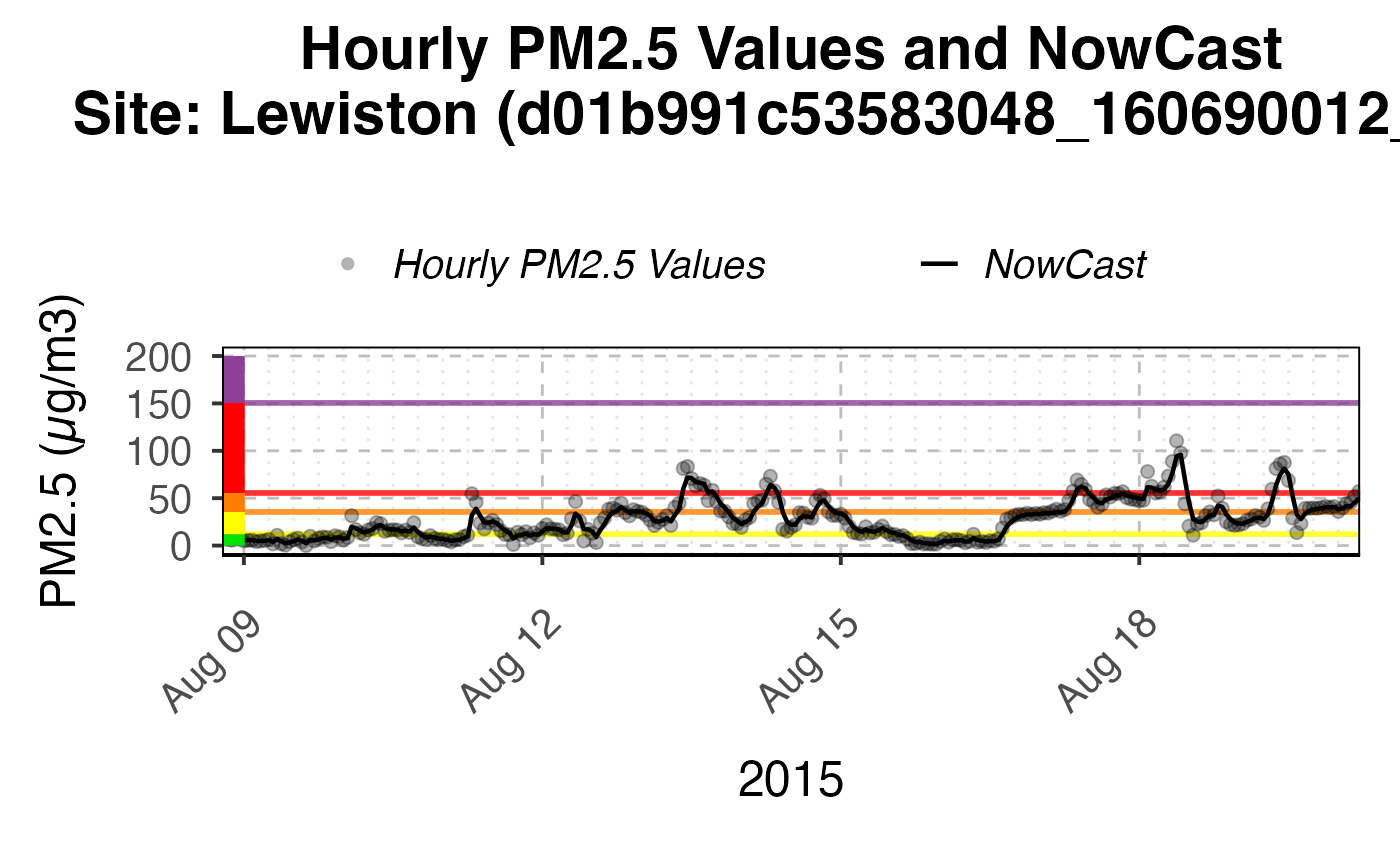
AirMonitor::NW_Megafires %>%
  monitor_ggTimeseries_archival(
    startdate = 20150809,
    enddate = 20150820,
    id = "d01b991c53583048_160690012_03",
    timezone = "America/Los_Angeles"
 )
#> Warning: The following aesthetics were dropped during statistical transformation: x and
#> y.
#> ℹ This can happen when ggplot fails to infer the correct grouping structure in
#>   the data.
#> ℹ Did you forget to specify a `group` aesthetic or to convert a numerical
#>   variable into a factor?
#> Warning: Removed 805 rows containing missing values or values outside the scale range
#> (`geom_path()`).


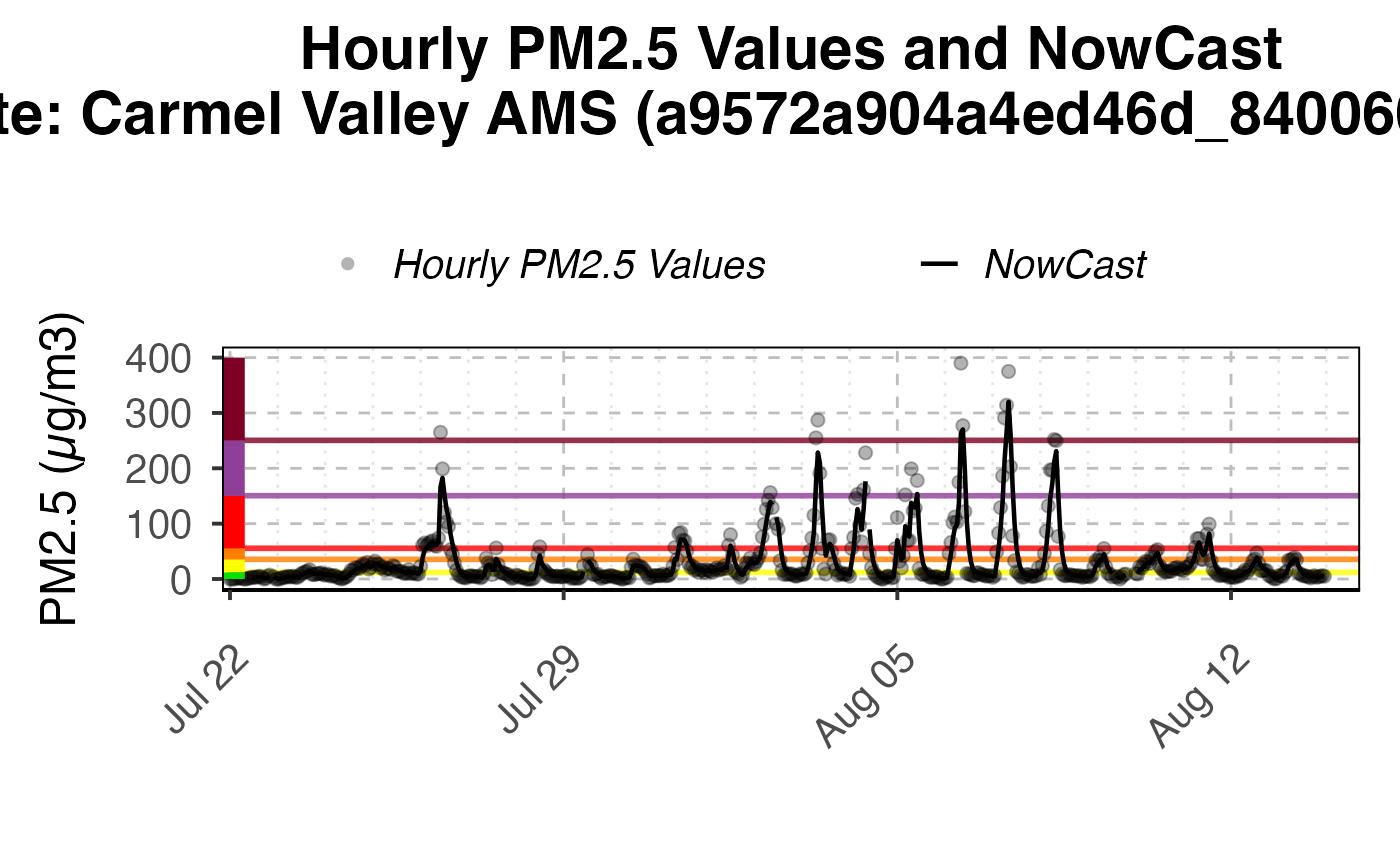
AirMonitor::Carmel_Valley %>%
  AirMonitor::monitor_trimDate() %>%
  monitor_ggTimeseries_archival()
#> Warning: The following aesthetics were dropped during statistical transformation: x and
#> y.
#> ℹ This can happen when ggplot fails to infer the correct grouping structure in
#>   the data.
#> ℹ Did you forget to specify a `group` aesthetic or to convert a numerical
#>   variable into a factor?
#> Warning: Removed 11 rows containing missing values or values outside the scale range
#> (`geom_path()`).
