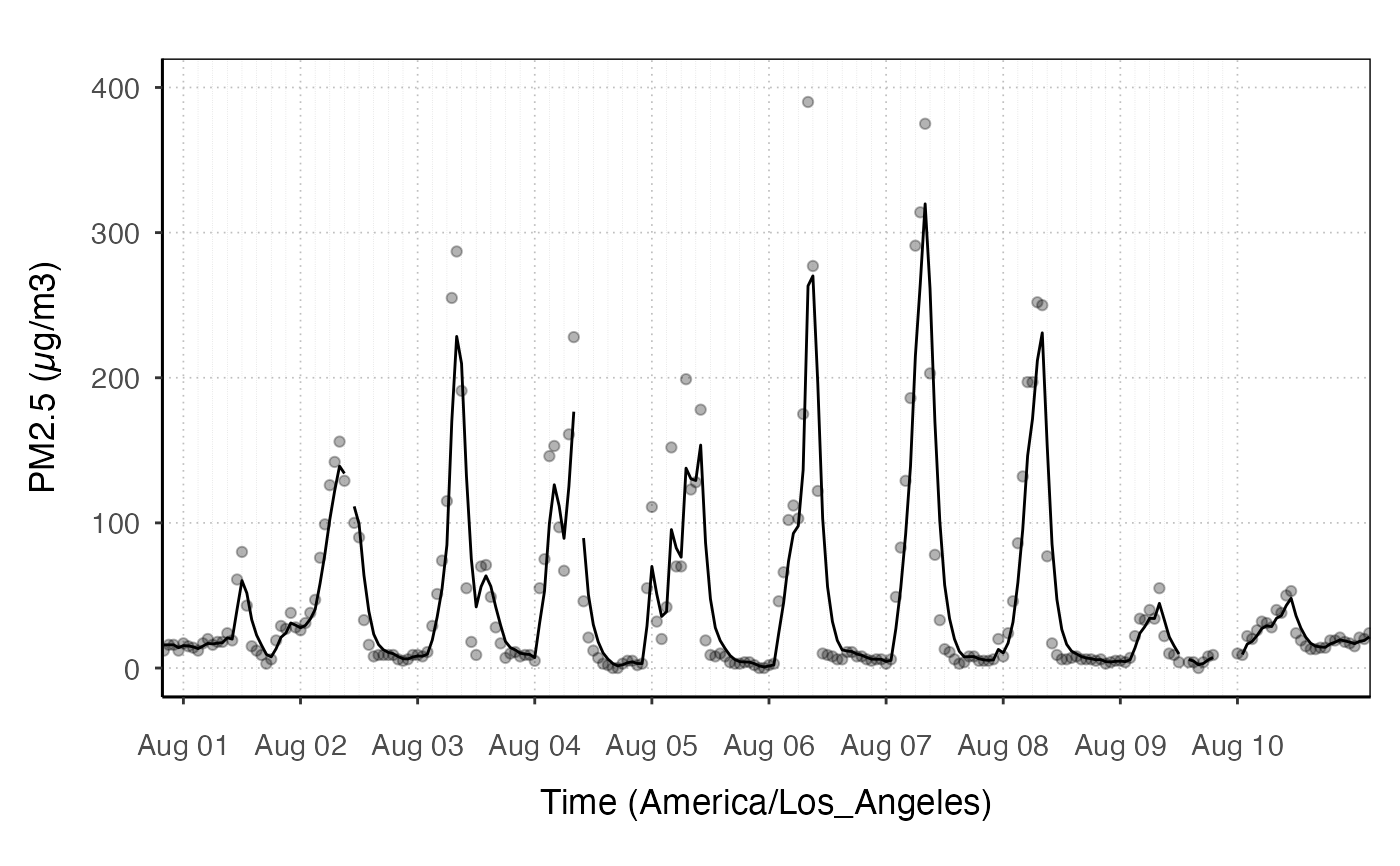
This function calculates the NowCast version of the data, and adds it to a plot. The default is to add a NowCast line.
stat_nowcast(
  mapping = NULL,
  data = NULL,
  version = "pm",
  includeShortTerm = FALSE,
  geom = "path",
  aqiColors = FALSE,
  mv4Colors = FALSE,
  position = "identity",
  na.rm = TRUE,
  show.legend = NA,
  inherit.aes = TRUE,
  ...
)
Arguments
- mapping
Set of aesthetic mappings created by
aes(). If specified andinherit.aes = TRUE(the default), it is combined with the default mapping at the top level of the plot. You must supplymappingif there is no plot mapping.- data
The data to be displayed in this layer. There are three options: if
NULL, the default, the data is inherited from the plot data. Adata.frameor other object, will override the plot data. Afunctionwill be called with a single argument, the plot data. The return value must be adata.frame, and will be used as the layer data.- version
character identity specifying the type of nowcast algorithm to be used. For details see monitor_nowcast.
- includeShortTerm
calculate preliminary NowCast values starting with the 2nd hour.
- geom
The geometic object to display the data
- aqiColors
if
TRUE, AQI colors will be displayed.- mv4Colors
if
TRUE, AQI colors from the monitoring V4 site will be used. Ignored ifaqiColorsisFALSE.- position
Position adjustment, either as a string, or the result of a call to a position adjustment function.
- na.rm
remove NA values from data
- show.legend
logical indicating whether this layer should be included in legends.
- inherit.aes
if
FALSE, overrides the default aesthetics, rather than combining with them. This is most useful for helper functions that define both data and the aesthetics and shouldn't inherit behaviour from the default plot specificatino, egborders().- ...
additional arguments passed on to
layer(), such as aesthetics.
Examples
library(AirMonitorPlots)

ggplot_pm25Timeseries(
  AirMonitor::Carmel_Valley,
  startdate = 20160801,
  enddate = 20160810
) +
  geom_pm25Points() +
  stat_nowcast()
#> Warning: Removed 328 rows containing missing values or values outside the scale range
#> (`geom_path()`).
