Apply hourly aggregation QC using "AB_O4" algorithm
Source:R/PurpleAirQC_hourly_AB_03.R
PurpleAirQC_hourly_AB_03.RdCreates a pm25 timeseries by averaging aggregated data from the A and B channels and applying the following QC logic:
Create pm25 by averaging the A and B channel aggregation means
Invalidate data where: (min_count < 20)
Invalidate data where: (A/B hourly difference > 5 AND A/B hourly percent difference > 70%)
Invalidate data where: (A/B hourly data recovery < 90%)
PurpleAirQC_hourly_AB_03(pat = NULL, min_count = 20, returnAllColumns = FALSE)Arguments
- pat
A PurpleAir timeseries object.
- min_count
Aggregation bins with fewer than
min_countmeasurements will be marked as NA.- returnAllColumns
Logical specifying whether to return all columns of statistical data generated for QC algorithm or just the final
pm25result.
Value
Data frame with columns datetime and pm25.
Note
Purple Air II sensors reporting after the June, 2019 firmware
upgrade report data every 2 minutes or 30 measurements per hour. The default
setting of min_count = 20 is equivalent to a required data recovery
rate of 67%.
Examples
# \donttest{
library(AirSensor)

df_00 <-
  example_pat %>%
  pat_qc() %>%
  PurpleAirQC_hourly_AB_00()

df_01 <-
  example_pat %>%
  pat_qc() %>%
  PurpleAirQC_hourly_AB_01()

df_02 <-
  example_pat %>%
  pat_qc() %>%
  PurpleAirQC_hourly_AB_02()

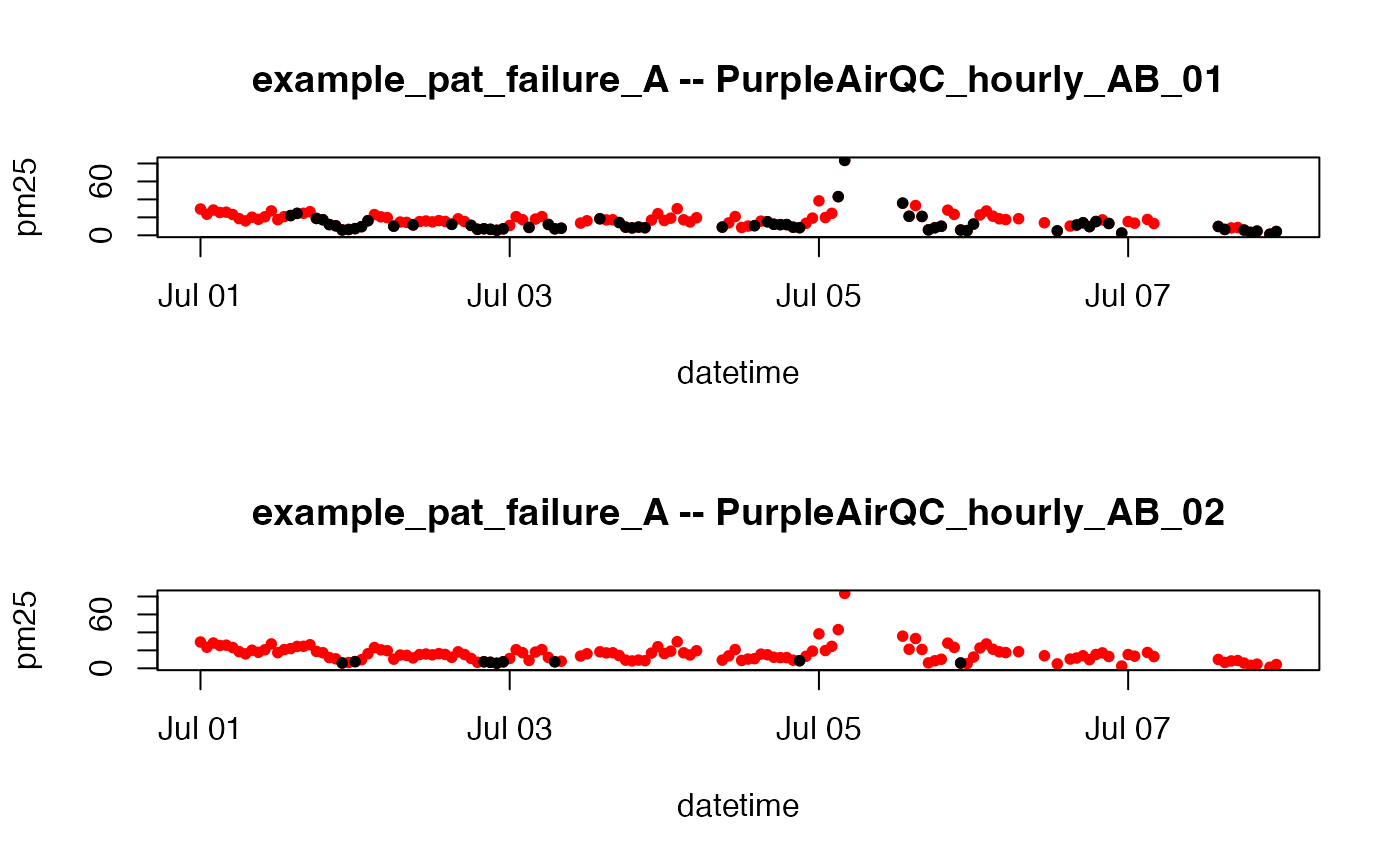
layout(matrix(seq(2)))

plot(df_00, pch = 16, cex = 0.8, col = "red")
points(df_01, pch = 16, cex = 0.8, col = "black")
title("example_pat_failure_A -- PurpleAirQC_hourly_AB_01")

plot(df_00, pch = 16, cex = 0.8, col = "red")
points(df_02, pch = 16, cex = 0.8, col = "black")
title("example_pat_failure_A -- PurpleAirQC_hourly_AB_02")


layout(1)
# }