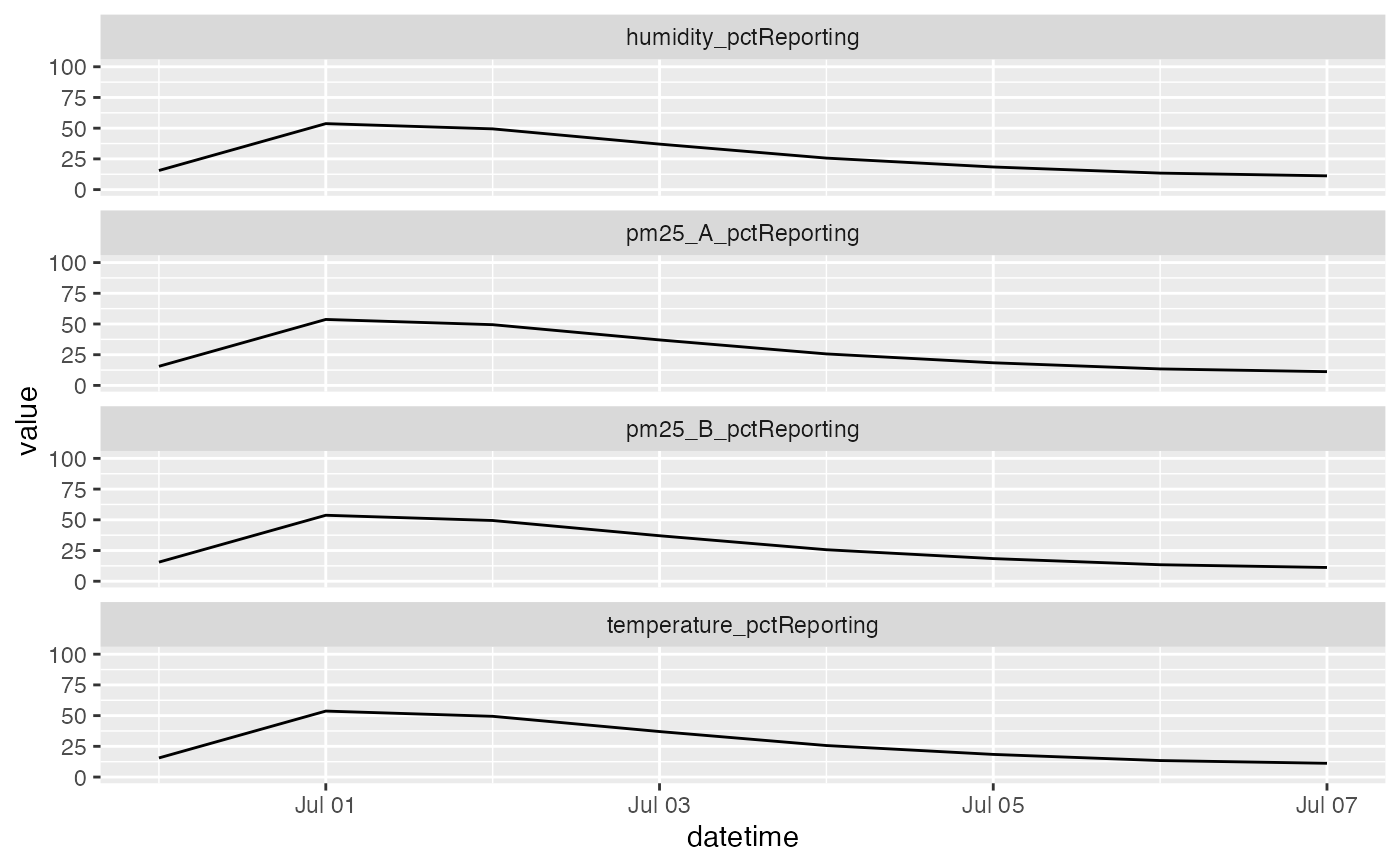
Daily reporting percentage
Source:R/PurpleAirSoH_dailyPctReporting.R
PurpleAirSoH_dailyPctReporting.RdThe number of sensor readings recorded per hour are summed over
the course of a calendar day. This is then divided by the
number of samples the sensor would record in an ideal day
(24 * 3600 / samplingInterval) to return a percentage of each
day that the sensor is reporting data.
PurpleAirSoH_dailyPctReporting(pat = NULL, samplingInterval = 120)Arguments
- pat
PurpleAir Timeseries pat object.
- samplingInterval
The number of seconds between samples when the sensor is operating optimally.
Note
Purple Air II sensors reporting after the June, 2019 firmware upgrade report data every 120 seconds. Prior to the upgrade, data were reported every 80 seconds.
Examples
library(AirSensor)

tbl <-
  example_pat %>%
  PurpleAirSoH_dailyPctReporting(80)

timeseriesTbl_multiPlot(tbl, ylim = c(0,101))
