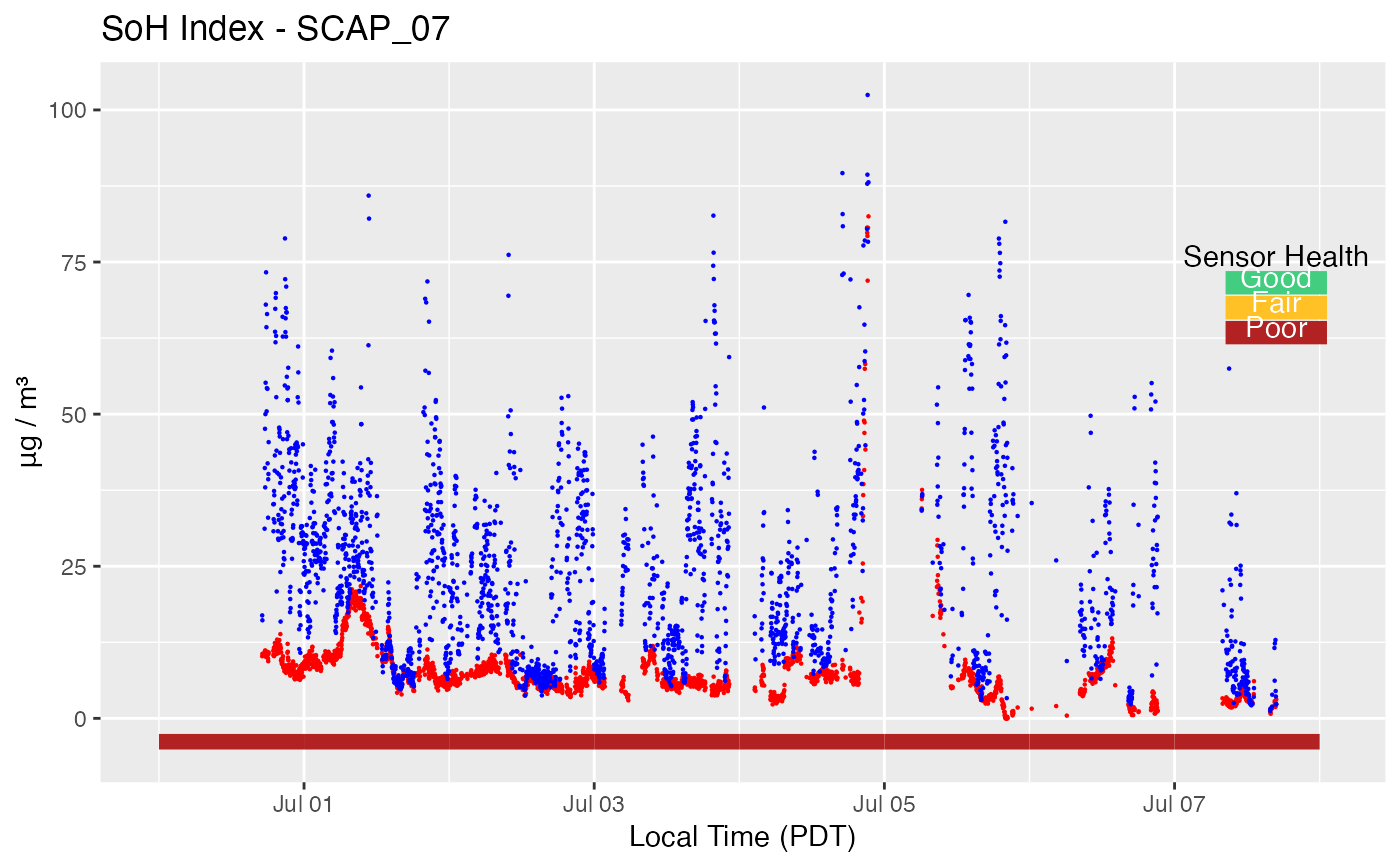
This function plots a subset of the most useful State of Health
metrics calculated with SoHIndex_FUN.
Both minPctReporting and breaks are passed to
SoHIndex_FUN.
pat_dailySoHIndexPlot(
  pat = NULL,
  minPctReporting = 50,
  breaks = c(0, 0.2, 0.8, 1),
  SoHIndex_FUN = pat_dailySoHIndex_00
)
Arguments
- pat
PurpleAir Timeseries pat object.
- minPctReporting
Percent reporting threshold for A and B channels.
- breaks
Breaks used to convert index values into index bins.
- SoHIndex_FUN
Function used to create
SoHIndextibble. (Not quoted.)