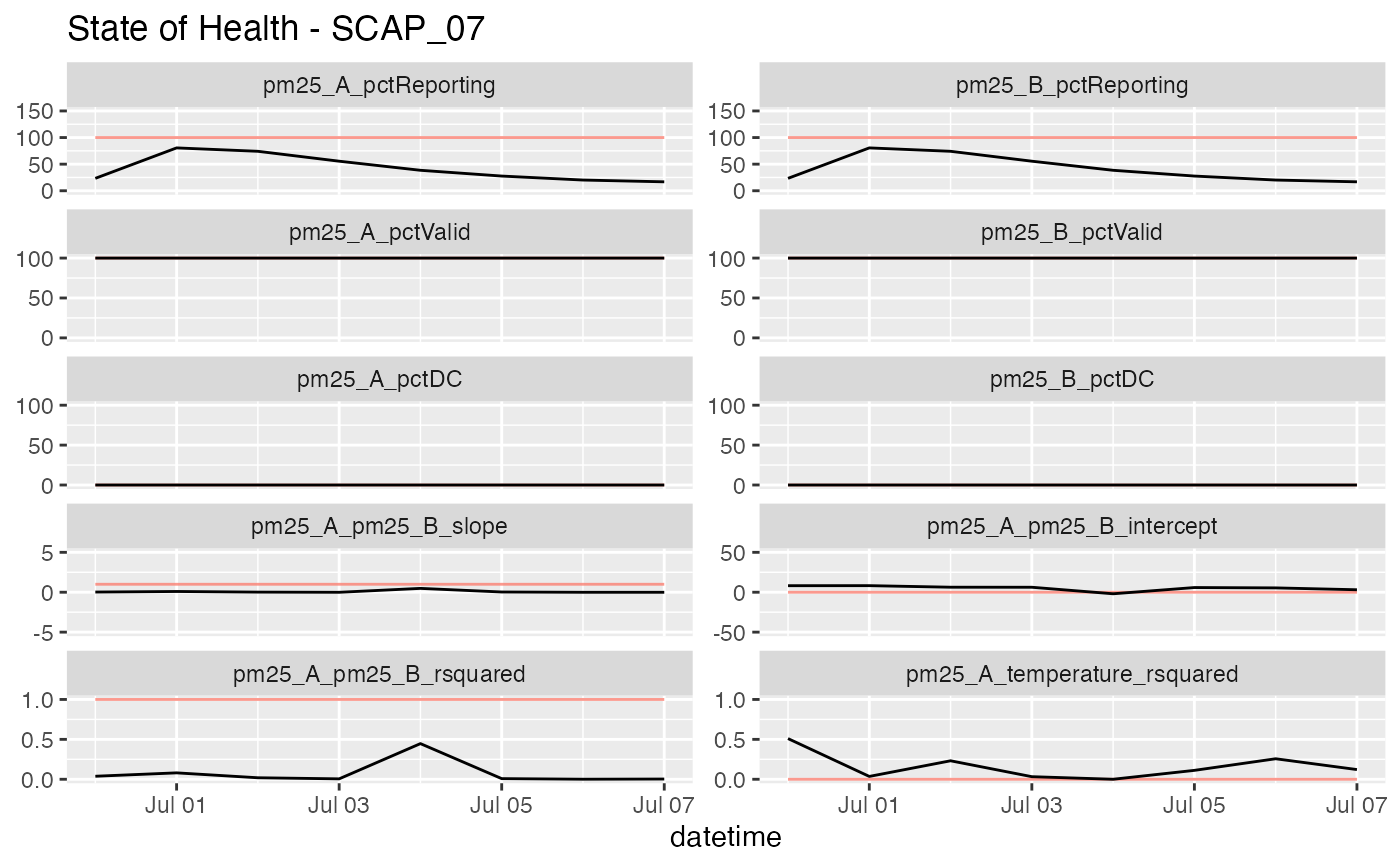
This function plots a subset of the most useful State of Health
metrics calculated by the pat_dailySoH function. The function
runs pat_dailySoH internally and uses the output to create
the plot.
pat_dailySoHPlot(pat = NULL, ncol = 2)Arguments
- pat
PurpleAir Timeseries pat object.
- ncol
Number of columns in the faceted plot.