Linear model fitting of PurpleAir and federal PWFSL time series data
Source:R/pat_externalFit.R
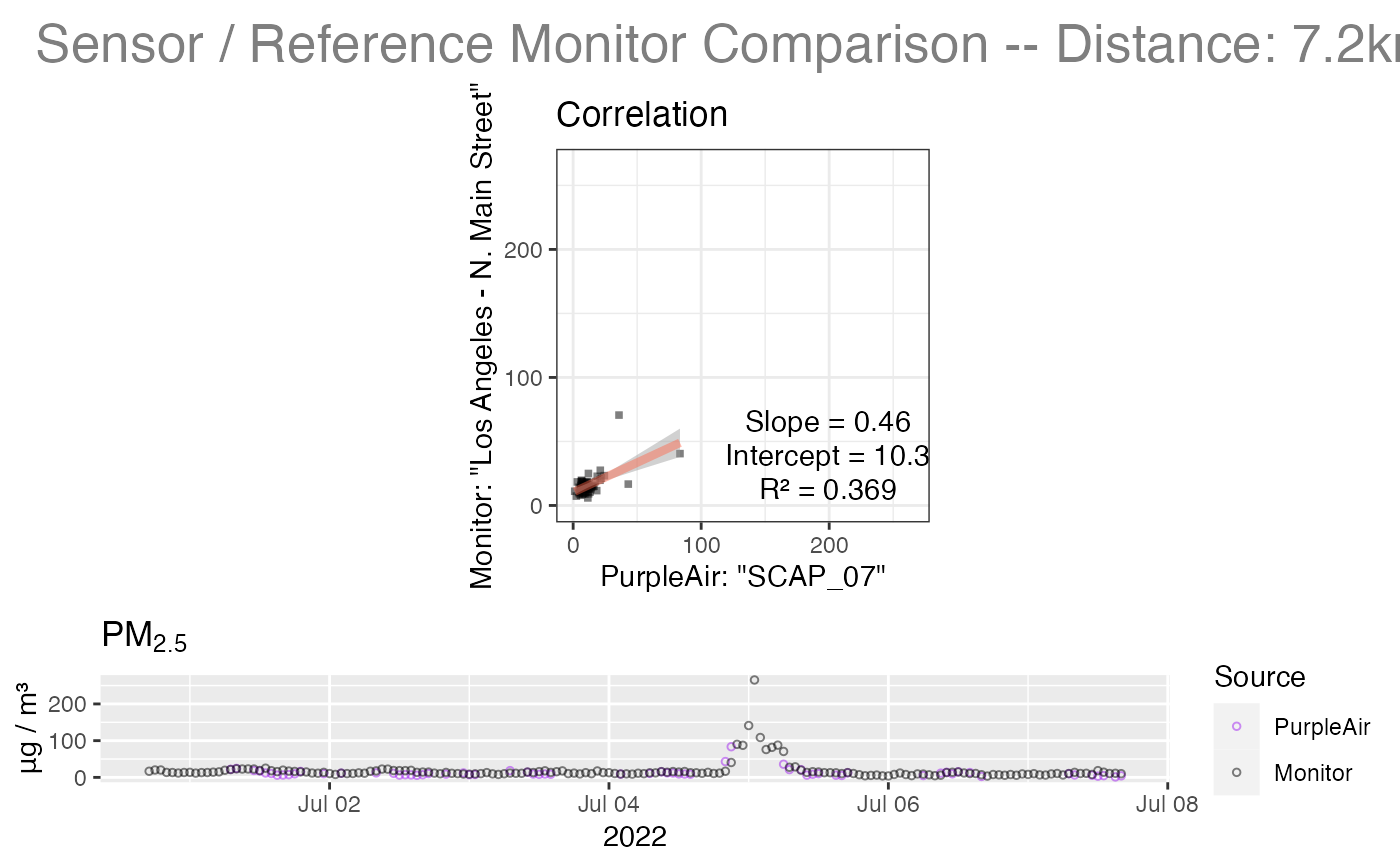
pat_externalFit.RdProduces a linear model between data from PurpleAir and data from the closest PWFSL monitor.
A diagnostic plot is produced if `showPlot = TRUE`.
pat_externalFit(
  pat = NULL,
  showPlot = TRUE,
  size = 1,
  pa_color = "purple",
  pwfsl_color = "black",
  alpha = 0.5,
  lr_shape = 15,
  lr_color = "black",
  lr_lwd = 1.5,
  lr_lcolor = "tomato",
  lr_lalpha = 0.45,
  ts_shape = 1,
  xylim = NULL,
  channel = "ab",
  replaceOutliers = TRUE,
  qc_algorithm = "hourly_AB_01",
  min_count = 20
)
Arguments
- pat
PurpleAir Timeseries pat object.
- showPlot
Logical specifying whether to generate a model fit plot.
- size
Size of points.
- pa_color
Color of hourly points.
- pwfsl_color
Color of hourly points.
- alpha
Opacity of points.
- lr_shape
Symbol to use for linear model points.
- lr_color
Color of linear model plot points.
- lr_lwd
Width of linear regression line.
- lr_lcolor
Color of linear regression line.
- lr_lalpha
Opacity of linear regression line.
- ts_shape
Symbol to use for time series points.
- xylim
Vector of (lo,hi) limits used as limits on the correlation plot axes -- useful for zooming in.
- channel
Data channel to use for PM2.5 -- one of "a", "b or "ab".
- replaceOutliers
Logical specifying whether or not to replace outliers.
- qc_algorithm
Named QC algorithm to apply to hourly aggregation stats.
- min_count
Aggregation bins with fewer than `min_count` measurements will be marked as `NA`.
Value
A linear model, fitting the `pat` PurpleAir readings to the closest PWFSL monitor readings.
Examples
# \donttest{
library(AirSensor)

pat_externalFit(example_pat)
#> Warning: Removed 104 rows containing non-finite values (`stat_smooth()`).
#> `geom_smooth()` using formula = 'y ~ x'
#> Warning: Removed 104 rows containing non-finite values (`stat_smooth()`).
#> Warning: Removed 104 rows containing missing values (`geom_point()`).
#> Warning: Removed 104 rows containing missing values (`geom_point()`).

# }
# }