Linear model fitting of channel A and B time series data
Source:R/pat_internalFit.R
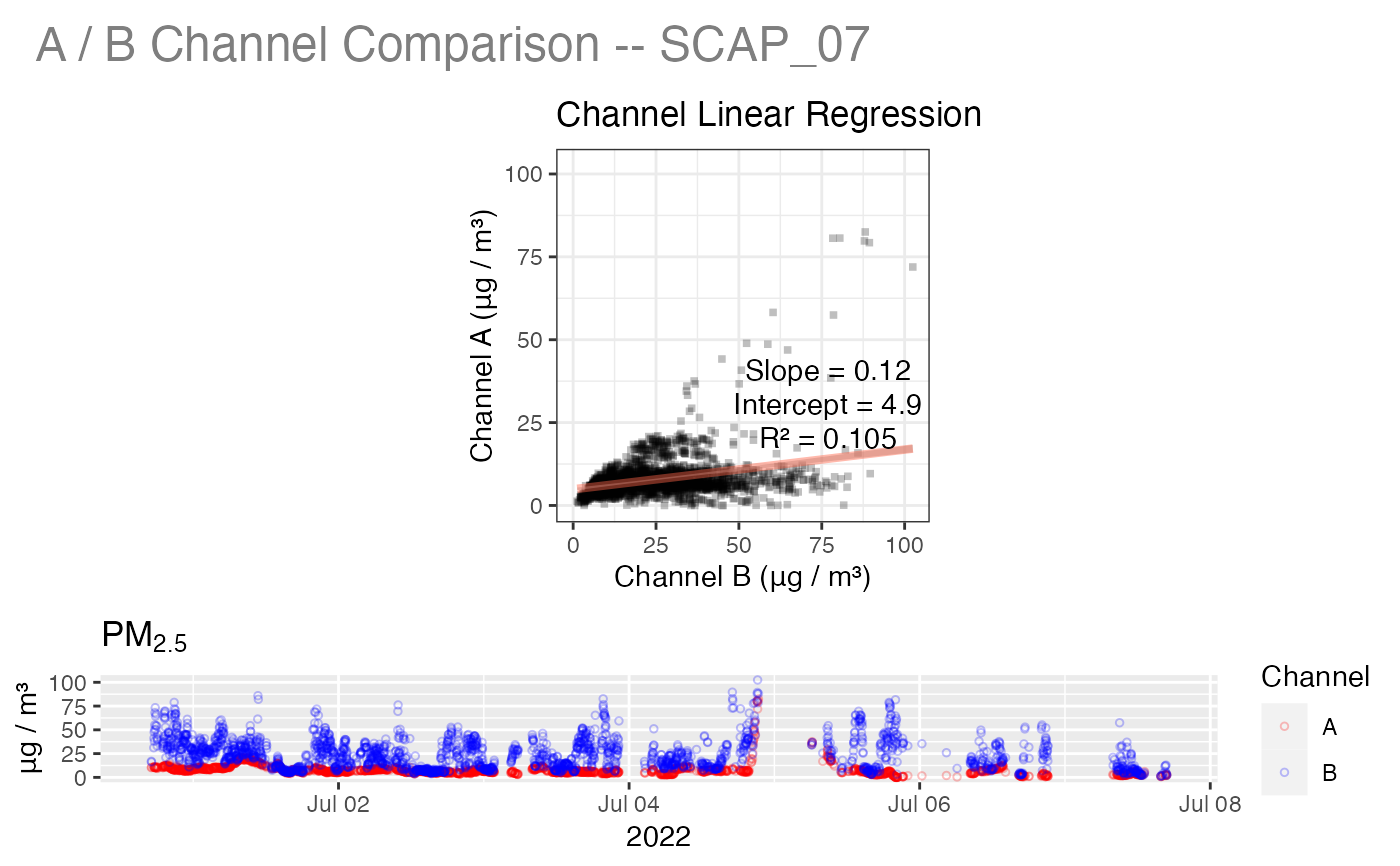
pat_internalFit.RdUses a linear model to fit data from channel B to data from channel A.
A diagnostic plot is produced if showPlot = TRUE.
pat_internalFit(
  pat = NULL,
  showPlot = TRUE,
  size = 1,
  a_color = "red",
  b_color = "blue",
  alpha = 0.25,
  lr_shape = 15,
  lr_color = "black",
  lr_lwd = 1.5,
  lr_lcolor = "tomato",
  lr_lalpha = 0.45,
  ts_shape = 1,
  xylim = NULL
)
Arguments
- pat
PurpleAir Timeseries pat object.
- showPlot
Logical specifying whether to generate a model fit plot.
- size
Size of points.
- a_color
Color of time series channel A points.
- b_color
Color of time series channel B points.
- alpha
Opacity of points.
- lr_shape
Symbol to use for linear regression points.
- lr_color
Color of linear regression points.
- lr_lwd
Width of linear regression line.
- lr_lcolor
Color of linear regression line.
- lr_lalpha
Opacity of linear regression line.
- ts_shape
Symbol to use for time series points.
- xylim
Vector of (lo,hi) limits used as limits on the correlation plot axes -- useful for zooming in.
Value
A linear model, fitting the pat B channel readings to A channel
readings.