Comparison of Purple Air and federal monitoring data
Source:R/pat_monitorComparison.R
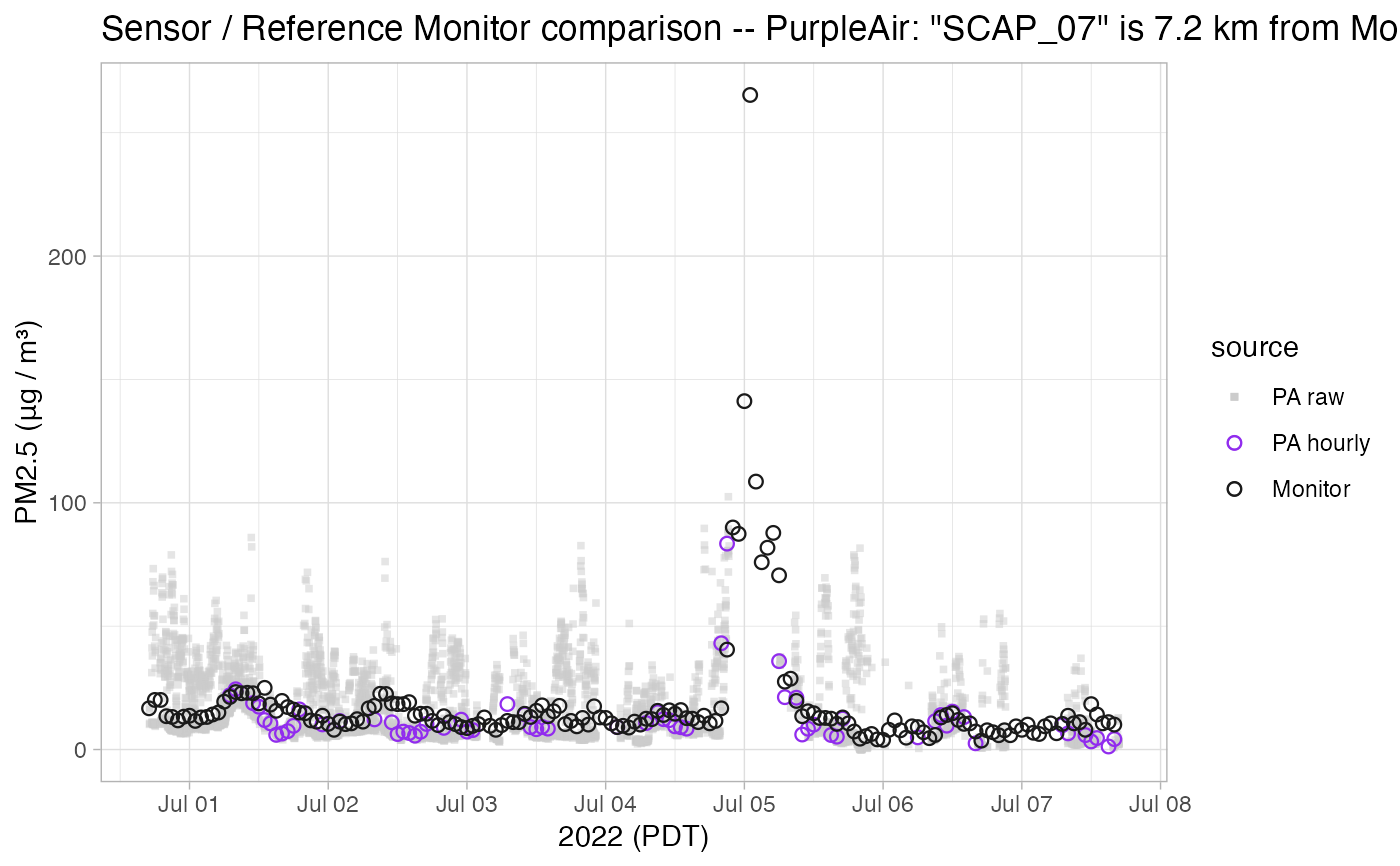
pat_monitorComparison.RdCreates and returns a ggplot object that plots raw pat data, hourly aggregated pat data and hourly data from the nearest federal monitor from the PWFSL database.
pat_monitorComparison(
  pat = NULL,
  FUN = AirSensor::PurpleAirQC_hourly_AB_01,
  distanceCutoff = 20,
  ylim = NULL,
  replaceOutliers = TRUE,
  timezone = NULL
)
Arguments
- pat
PurpleAir Timeseries pat object.
- FUN
Algorithm applied to pat object for hourly aggregation and quality control. See
pat_createAirSensor()for more details.- distanceCutoff
Numeric distance (km) cutoff for nearest PWFSL monitor.
- ylim
Vector of (lo,hi) y-axis limits.
- replaceOutliers
Logical specifying whether replace outliers in the pat object.
- timezone
Olson timezone used for the time axis. (Defaults to
patlocal time.)
Value
A ggplot object.