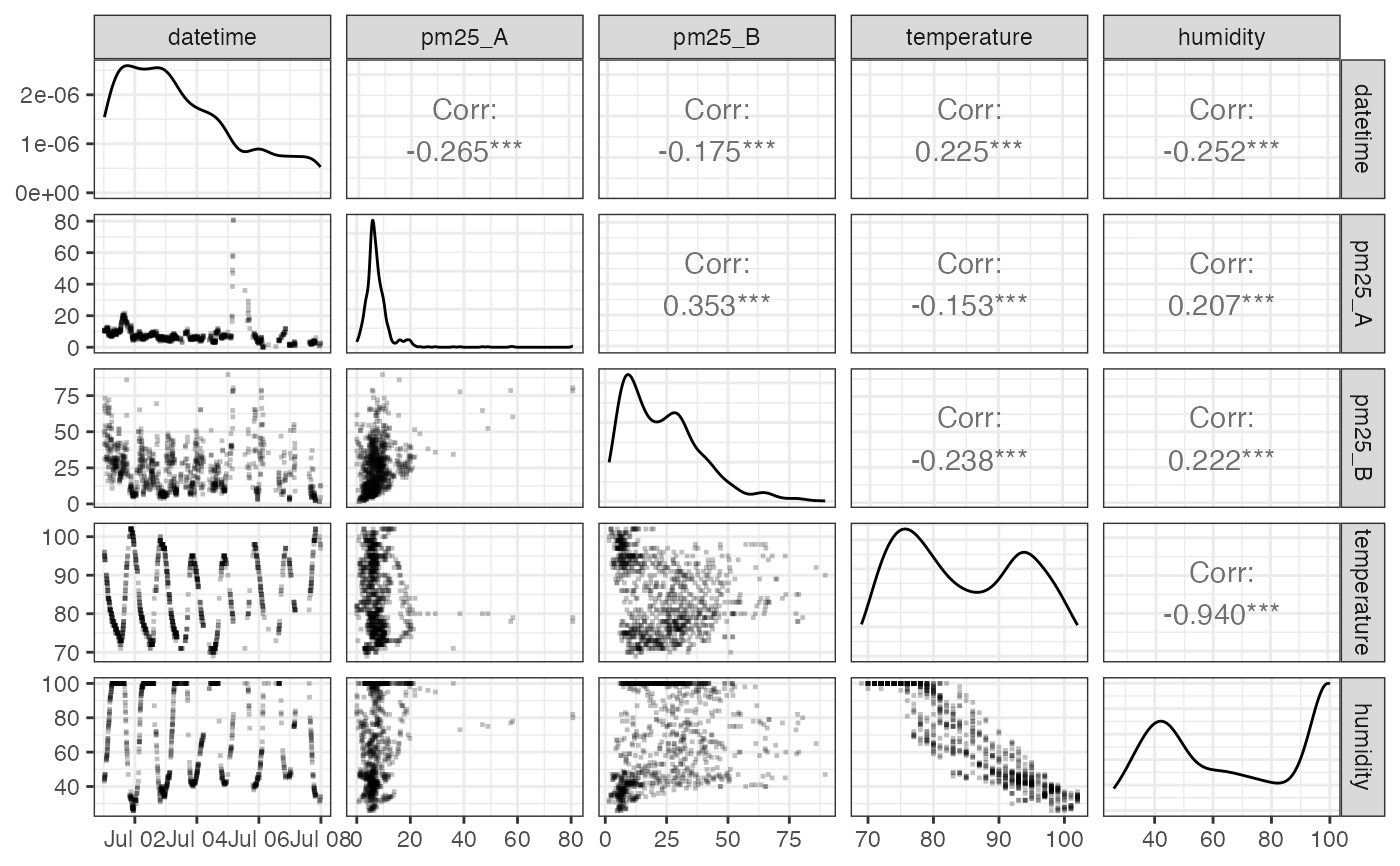
Draw a matrix of PurpleAir Timeseries data scatter plots
Source:R/pat_scatterPlotMatrix.R
pat_scatterPlotMatrix.RdCreates a multi-panel scatterPlot comparing all variables in the pat object. If any variables have no valid data, they are omitted from the plot.
The list of available parameters include:
datetime-- measurement timepm25_A-- A channel PM2.5 (ug/m3)pm25_B-- B channel PM2.5 (ug/m3)temperature-- temperature (F)humidity-- humidity (%)
pat_scatterPlotMatrix(
  pat = NULL,
  parameters = c("datetime", "pm25_A", "pm25_B", "temperature", "humidity"),
  sampleSize = 5000,
  sampleFraction = NULL,
  size = 0.5,
  shape = 15,
  color = "black",
  alpha = 0.25
)
Arguments
- pat
PurpleAir Timeseries pat object.
- parameters
Vector of parameters to include.
- sampleSize
Integer to determine sample size.
- sampleFraction
Fractional sample size.
- size
Size of points.
- shape
Symbol to use for points.
- color
Color of points.
- alpha
Opacity of points.
Value
Multi-panel ggplot comparing all parameters.
