Create a quick plot of a GOES AOD SpatialPointsDataFrame
goesaodc_plotSpatialPoints.RdQuickly subsample and plot points in a GOES AOD spatialPointsDataFrame
goesaodc_plotSpatialPoints(
  spatialPoints,
  var = "AOD",
  n = 1e+05,
  colBins = 5,
  breaks = NULL,
  paletteName = "YlOrRd",
  pch = 15,
  cex = 0.5,
  add = FALSE
)
Arguments
| spatialPoints | SpatialPointsDataFrame |
|---|---|
| var | Variable to plot |
| n | Sample size |
| colBins | number of color bins |
| breaks | vector of color breaks |
| paletteName | RColorBrewer palette name |
| pch | plot character |
| cex | plot symbol scale factor |
| add | logical specifying whether to create a new plot or add to existing |
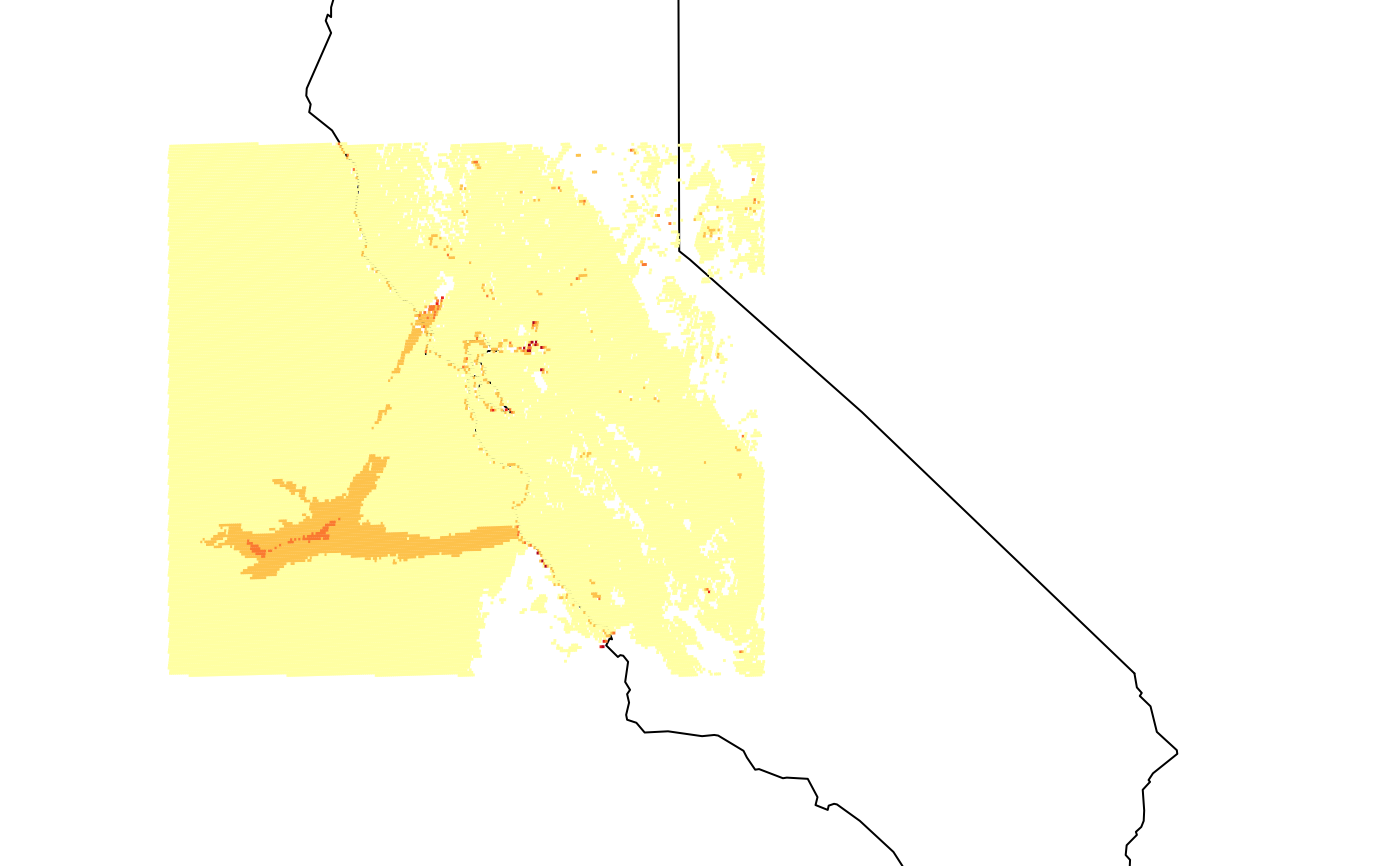
Examples
# \donttest{
library(MazamaSatelliteUtils)
setSatelliteDataDir("~/Data/Satellite")

netCDF <- goesaodc_downloadAOD(
  satID = "G17",
  datetime = "2019-10-27 10",
  timezone = "America/Los_Angeles"
  )[1]

kincade_bbox <- c(-126, -119, 35, 40)

nc <- goesaodc_openFile(netCDF)
sp <- goesaodc_createSpatialPoints(nc, dqfLevel = 3, bbox = kincade_bbox)
maps::map(database = "state", "regions" = c("california"), xlim = c(-126, -113.5))goesaodc_plotSpatialPoints(sp, cex = 0.2, add = TRUE)# }