Uses the tmap package to generate a thematic map at the
county level. Input consists of a dataframe with countyFIPS identifiers.
Data to plot is specified with parameter argument. If parameter
is mult-valued, mutliple plots will be generated and displayed as "facets".
The returned object is a tmap ggplot object which can be further modified with tmap or ggplot options.
countyMap(
  data = NULL,
  parameter = NULL,
  state_SFDF = "USCensusStates_02",
  county_SFDF = "USCensusCounties_02",
  breaks = NULL,
  palette = "brewer.blues",
  conusOnly = TRUE,
  stateCode = NULL,
  projection = NULL,
  stateBorderColor = "gray50",
  countyBorderColor = "white",
  title = NULL,
  showLegend = TRUE,
  legendTitle = NULL,
  legendOrientation = c("portrait", "landscape"),
  legendPosition = NULL
)
Arguments
- data
Dataframe containing values to plot. This dataframe must contain a column named
countyFIPSwith the 5-digit FIPS code.- parameter
Name of the column in
datato use for coloring the map.- state_SFDF
simple features data frame with US states. It's data
@slotmust contain a column namedstateCodeif eitherconusOnly = TRUEor thestateCodeargument is specified.- county_SFDF
simple features data frame with US counties. It's data
@slotmust always contain a column named andcountyFIPSand a column namedstateCodeif eitherconusOnly = TRUEor thestateCodeargument is specified.- breaks
Numeric vector of break points.
- palette
A vector of colors or palette name from the cols4all package (see
cols4all::c4a).- conusOnly
Logical specifying Continental US state codes. Ignored when the
stateCodeargument is specified.- stateCode
Vector of state codes to include on the map.
- projection
Named projection, e.g. "EPSG:4326" or "WGS84" or proj4string.
- stateBorderColor
Color used for state borders.
- countyBorderColor
Color used for county borders.
- title
Vector of text strings to use as individual plot titles. This must be the same length as 'parameter'.
- showLegend
Logical specifying whether or not to show the legend.
- legendTitle
Text string to use as the legend title.
- legendOrientation
Orientation of the legend. Either "portrait" or "landscape".
- legendPosition
A tm_pos object generated with
tmap::tm_pos_in()ortmap::tm_pos_out().
Value
A ggplot object.
Examples
# \donttest{
library(MazamaSpatialPlots)
mazama_initialize()
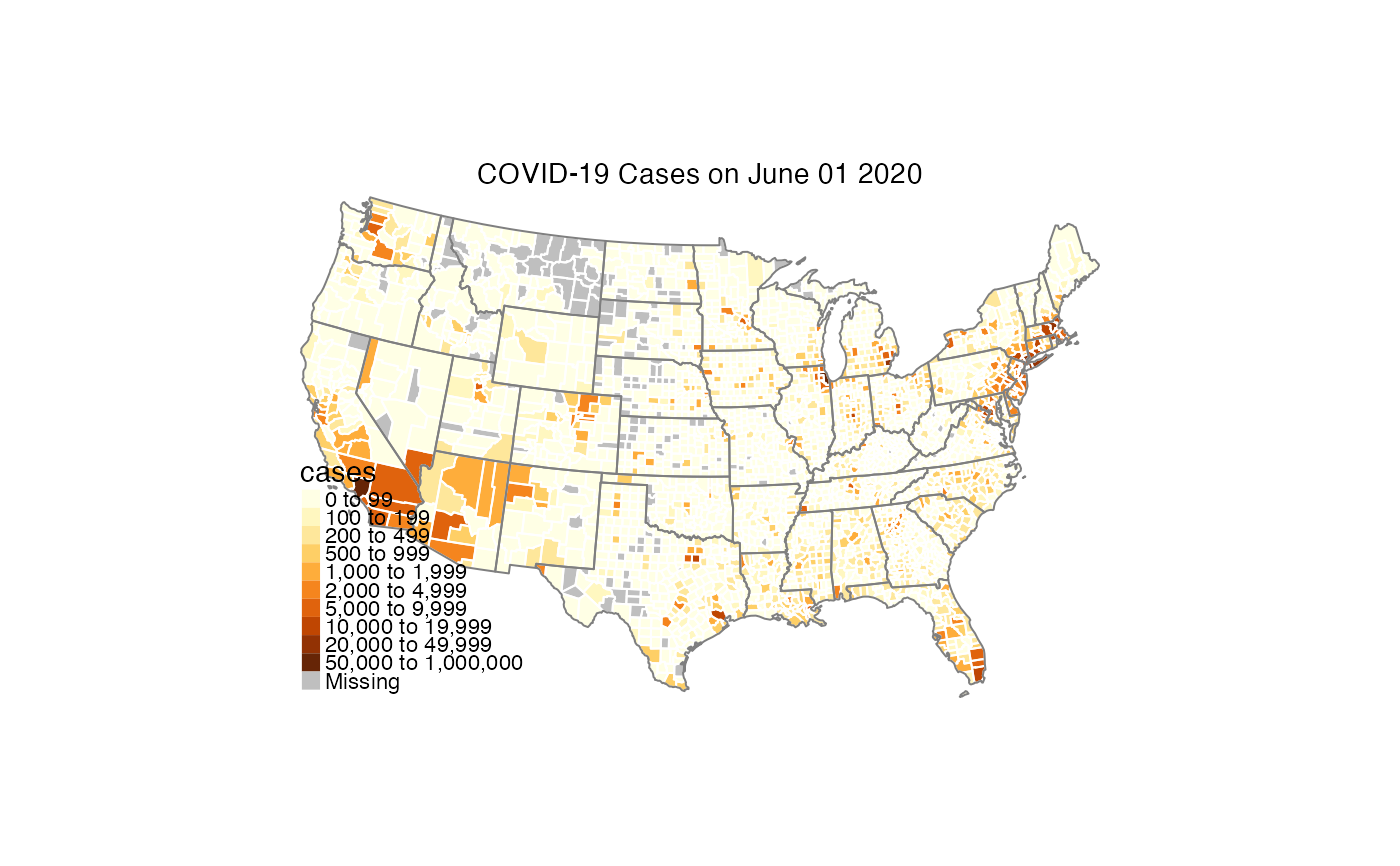
countyMap(
data = example_US_countyCovid,
parameter = "cases",
breaks = c(0,100,200,500,1000,2000,5000,10000,20000,50000,1e6),
title = "COVID-19 Cases on June 01 2020"
)
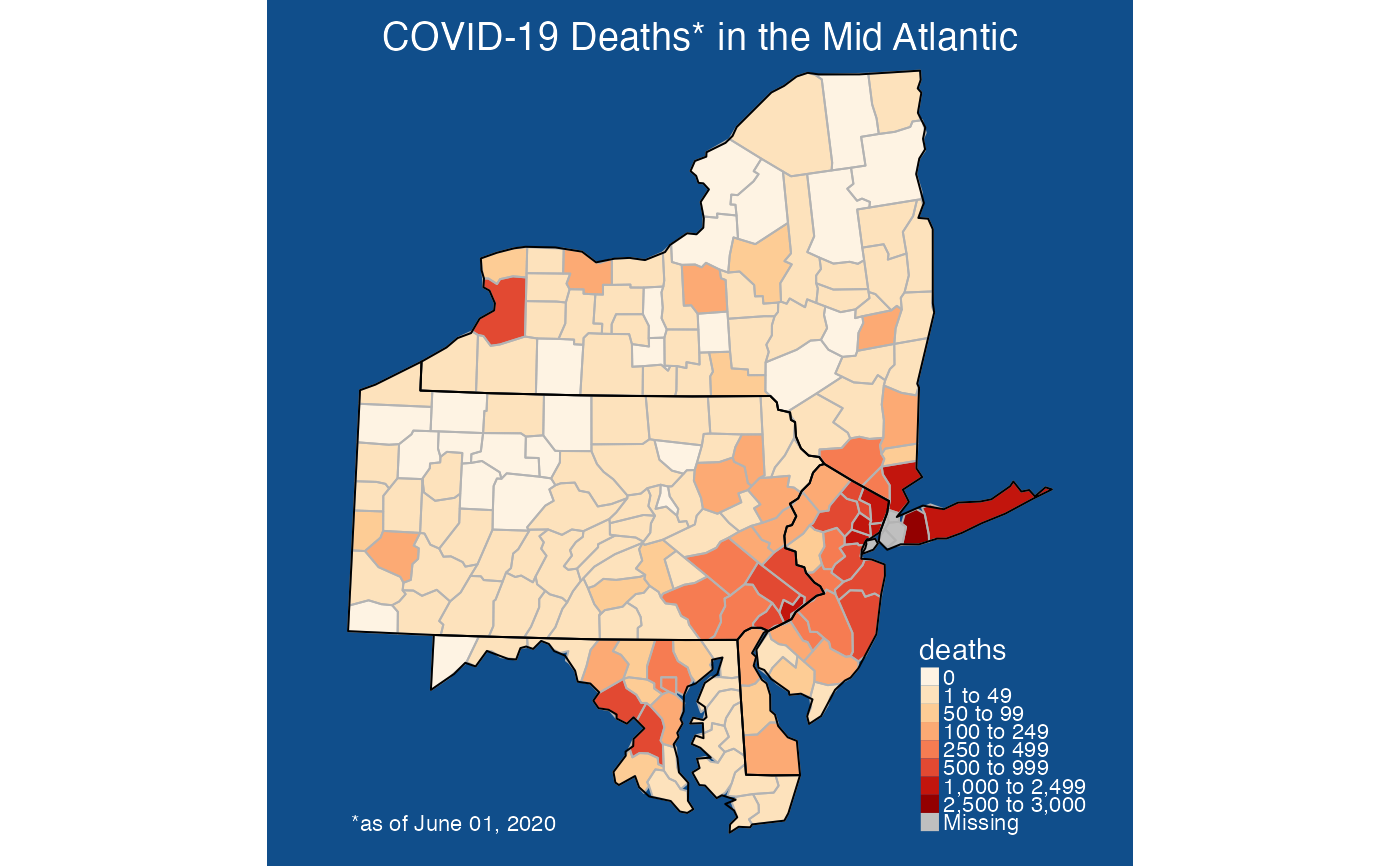
 countyMap(
data = example_US_countyCovid,
parameter = "deaths",
state_SFDF = USCensusStates_02,
county_SFDF = USCensusCounties_02,
breaks = c(0, 1, 50, 100, 250, 500, 1000, 2500, 3000),
palette = "brewer.or_rd",
stateCode = c( "NY", "PA", "MD", "NJ", "DE"),
stateBorderColor = "black",
countyBorderColor = 'grey70'
) +
tmap::tm_layout(
attr.color = 'white',
bg.color = "dodgerblue4"
) +
tmap::tm_title(
text = "COVID-19 Deaths* in the Mid Atlantic",
size = 2.0,
color = "white",
) +
tmap::tm_credits("*as of June 01, 2020", col = "white", position = "left")
countyMap(
data = example_US_countyCovid,
parameter = "deaths",
state_SFDF = USCensusStates_02,
county_SFDF = USCensusCounties_02,
breaks = c(0, 1, 50, 100, 250, 500, 1000, 2500, 3000),
palette = "brewer.or_rd",
stateCode = c( "NY", "PA", "MD", "NJ", "DE"),
stateBorderColor = "black",
countyBorderColor = 'grey70'
) +
tmap::tm_layout(
attr.color = 'white',
bg.color = "dodgerblue4"
) +
tmap::tm_title(
text = "COVID-19 Deaths* in the Mid Atlantic",
size = 2.0,
color = "white",
) +
tmap::tm_credits("*as of June 01, 2020", col = "white", position = "left")
 # }
# }