Uses the tmap package to generate a thematic map at the
state level. Input consists of a dataframe with stateCode identifiers.
Data to plot is specified with parameter argument. If parameter
is mult-valued, mutliple plots will be generated and displayed as "facets".
The returned object is a tmap ggplot object which can be further modified with tmap or ggplot options.
stateMap(
  data = NULL,
  parameter = NULL,
  state_SFDF = "USCensusStates_02",
  breaks = NULL,
  palette = "brewer.blues",
  conusOnly = TRUE,
  stateCode = NULL,
  projection = NULL,
  stateBorderColor = "gray50",
  title = NULL,
  showLegend = TRUE,
  legendTitle = NULL,
  legendOrientation = "portrait",
  legendPosition = NULL
)
Arguments
- data
Dataframe containing values to plot. This dataframe must contain a column named
stateCodewith the 2-character state code.- parameter
Name of the column in
datato use for coloring the map.- state_SFDF
simple features data frame with US states. It's data
@slotmust contain a column namedstateCodewith the 2-character state code.- breaks
Numeric vector of break points.
- palette
A vector of colors or palette name from the cols4all package (see
cols4all::c4a).- conusOnly
Logical specifying Continental US state codes. Ignored when the
stateCodeargument is specified.- stateCode
Vector of state codes to include on the map.
- projection
Named projection, e.g. "EPSG:4326" or "WGS84" or proj4string.
- stateBorderColor
Color used for state borders.
- title
Vector of text strings to use as individual plot titles. This must be the same length as 'parameter'.
- showLegend
Logical specifying whether or not to show the legend.
- legendTitle
Text string to use as the legend title.
- legendOrientation
Orientation of the legend. Either "portrait" or "landscape".
- legendPosition
A tm_pos object generated with
tmap::tm_pos_in()ortmap::tm_pos_out().
Value
A ggplot object.
Examples
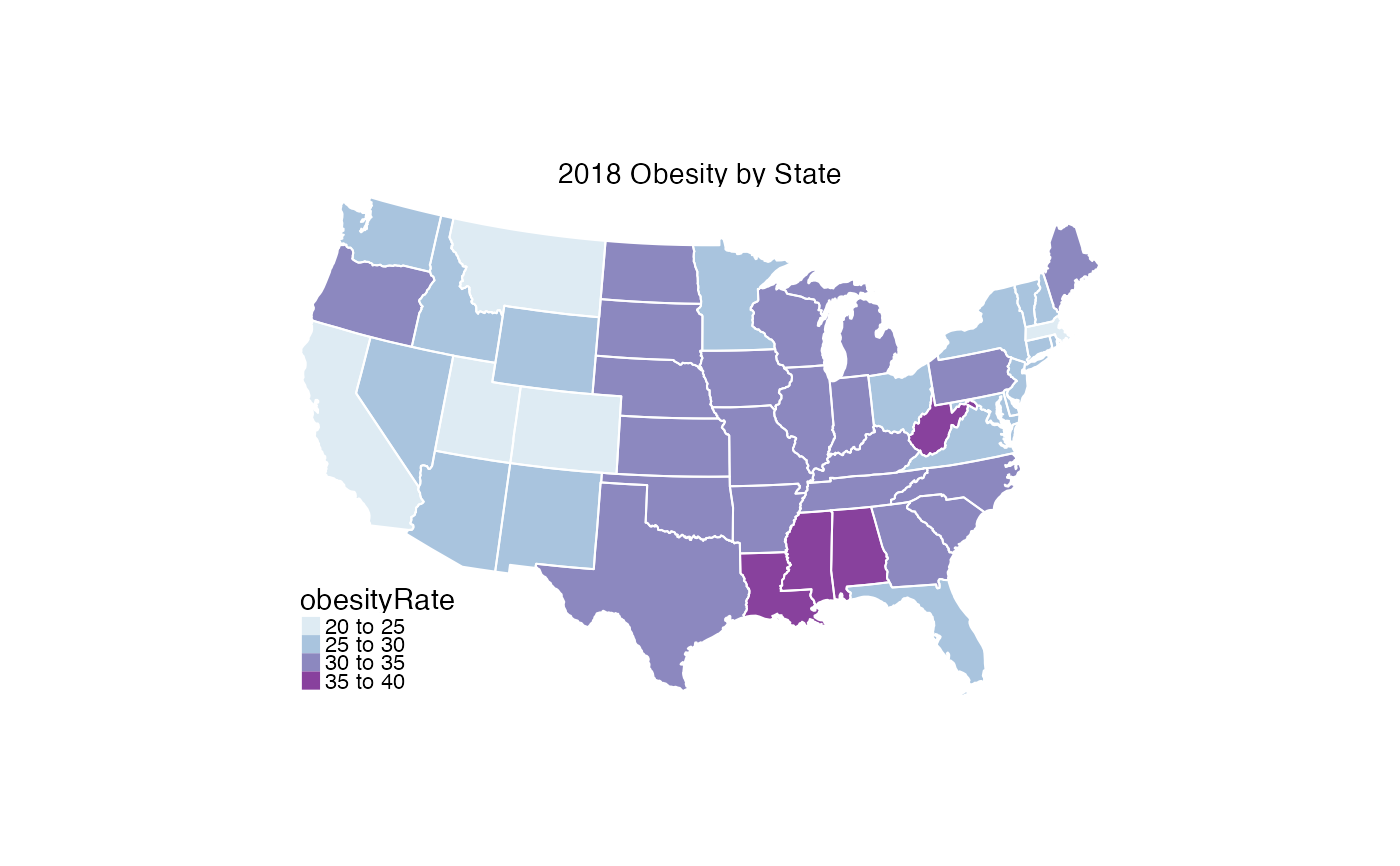
library(MazamaSpatialPlots)
stateMap(
data = example_US_stateObesity,
parameter = "obesityRate",
stateBorderColor = "white",
title = "2018 Obesity by State"
)
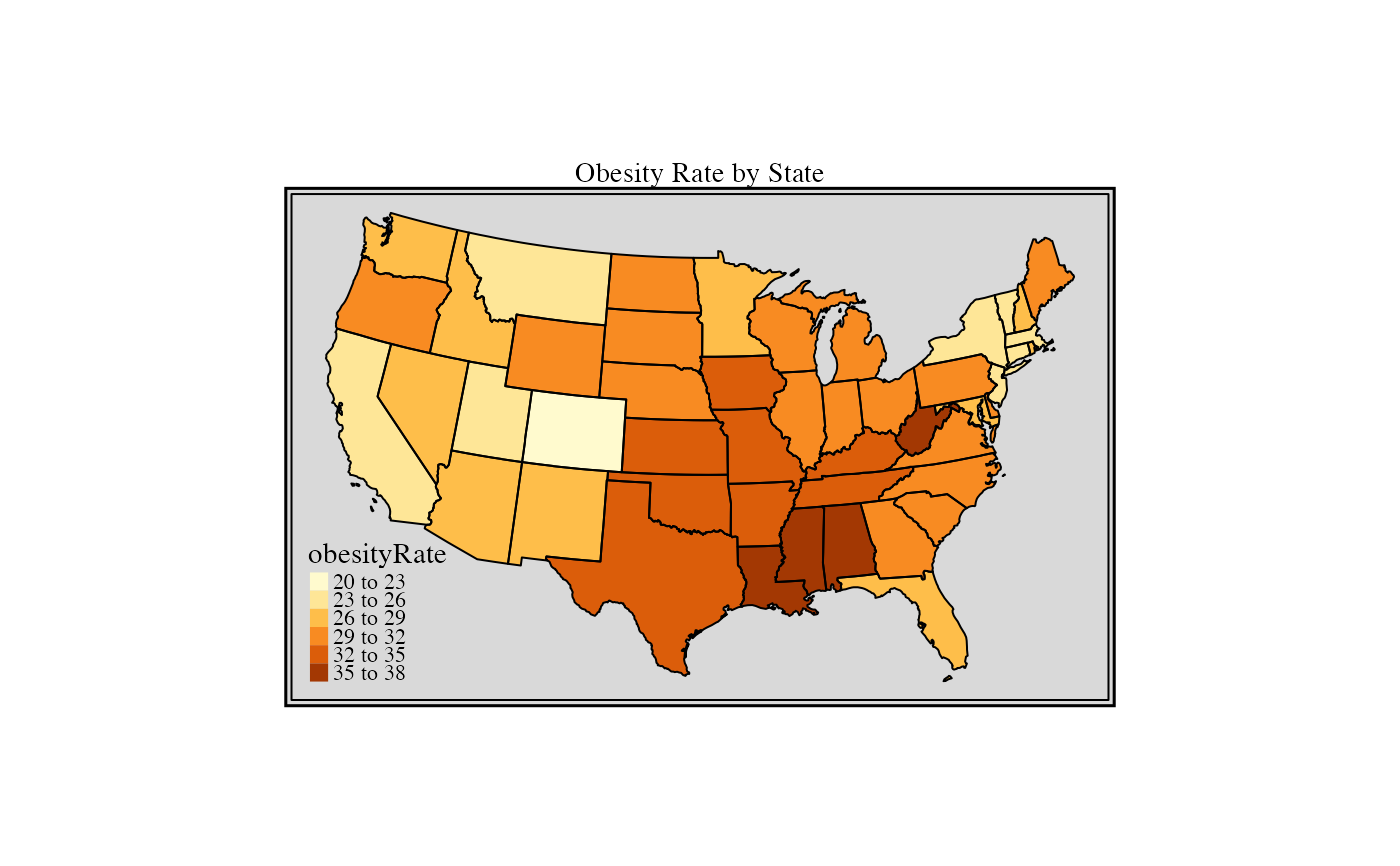
 # Example of customization using tm_layout and breaks parameter
stateMap(
data = example_US_stateObesity,
parameter = "obesityRate",
breaks = seq(20,38,3),
stateBorderColor = 'black'
) +
tmap::tm_layout(
frame = TRUE,
frame.double.line = TRUE,
bg.color = "grey85",
inner.margins = .05
) +
tmap::tm_title(
text = 'Obesity Rate by State',
size = 1.5,
position = tmap::tm_pos_in("center", "top"),
fontfamily = "serif"
)
# Example of customization using tm_layout and breaks parameter
stateMap(
data = example_US_stateObesity,
parameter = "obesityRate",
breaks = seq(20,38,3),
stateBorderColor = 'black'
) +
tmap::tm_layout(
frame = TRUE,
frame.double.line = TRUE,
bg.color = "grey85",
inner.margins = .05
) +
tmap::tm_title(
text = 'Obesity Rate by State',
size = 1.5,
position = tmap::tm_pos_in("center", "top"),
fontfamily = "serif"
)
 # Example using stateCode
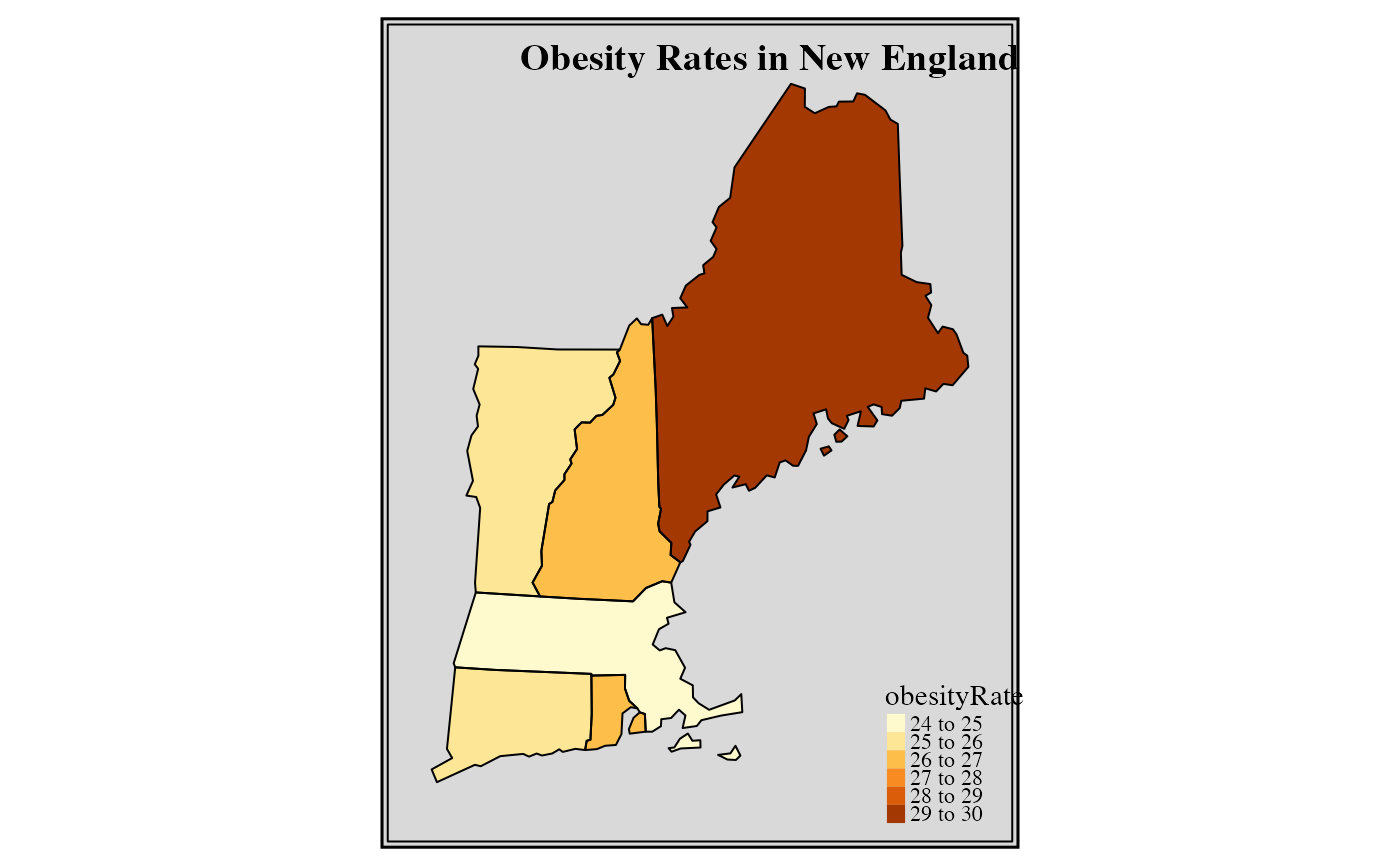
stateMap(
data = example_US_stateObesity,
parameter = "obesityRate",
stateCode = c('ME', 'NH', 'VT', 'MA', 'RI', 'CT'),
stateBorderColor = 'black',
legendPosition = tmap::tm_pos_in("right", "bottom")
) +
tmap::tm_layout(
frame = TRUE,
frame.double.line = TRUE,
bg.color = "grey85",
inner.margins = .08
) +
tmap::tm_title(
text = 'Obesity Rates in New England',
size = 1.5,
fontface = 2,
fontfamily = "serif",
position = tmap::tm_pos_in("center", "top")
)
# Example using stateCode
stateMap(
data = example_US_stateObesity,
parameter = "obesityRate",
stateCode = c('ME', 'NH', 'VT', 'MA', 'RI', 'CT'),
stateBorderColor = 'black',
legendPosition = tmap::tm_pos_in("right", "bottom")
) +
tmap::tm_layout(
frame = TRUE,
frame.double.line = TRUE,
bg.color = "grey85",
inner.margins = .08
) +
tmap::tm_title(
text = 'Obesity Rates in New England',
size = 1.5,
fontface = 2,
fontfamily = "serif",
position = tmap::tm_pos_in("center", "top")
)