Create a plot with default mappings and styling. Layers can then
be added to this plot using ggplot2 syntax.
ggplot_pm25Diurnal(
  monitor,
  startdate = NULL,
  enddate = NULL,
  timezone = NULL,
  ylim = NULL,
  shadedNight = TRUE,
  mapping = aes(x = .data[["hour"]], y = .data[["pm25"]]),
  base_size = 11,
  ...
)
Arguments
- monitor
Default dataset to use when adding layers. Must be either a mts_monitor object or
mts_tidyobject.- startdate
Desired startdate for data to include, in a format that can be parsed with parseDatetime.
- enddate
Desired enddate for data to include, in a format that can be parsed with parseDatetime.
- timezone
Timezone to use to set hours of the day.
- ylim
custom y-axis limits. This function will apply a default limit depending on the data.
- shadedNight
add nighttime shading based on of middle day in selected period.
- mapping
Default mapping for the plot.
- base_size
Base font size for theme.
- ...
Additional arguments passed on to
custom_pm25DiurnalScales.
Examples
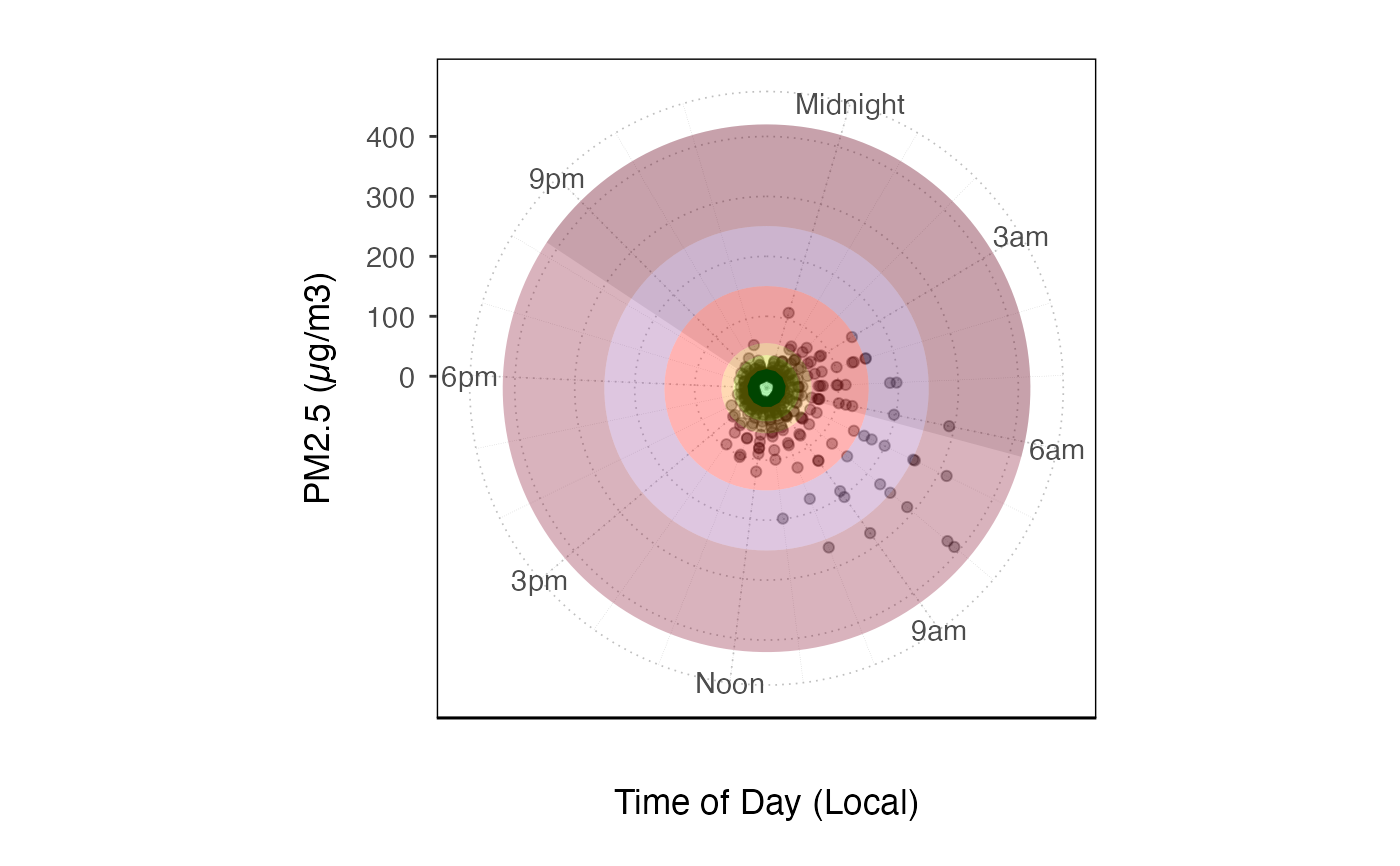
monitor <- AirMonitor::Carmel_Valley
ggplot_pm25Diurnal(monitor) +
  coord_polar() +
  geom_pm25Points() +
  custom_aqiStackedBar(width = 1, alpha = .3)
#> Warning: The following aesthetics were dropped during statistical transformation: x and
#> y.
#> ℹ This can happen when ggplot fails to infer the correct grouping structure in
#>   the data.
#> ℹ Did you forget to specify a `group` aesthetic or to convert a numerical
#>   variable into a factor?


ggplot_pm25Diurnal(
  monitor,
  startdate = 20160801,
  enddate = 20160810
) +
  stat_boxplot(aes(group = hour))
#> Warning: Removed 7 rows containing non-finite outside the scale range
#> (`stat_boxplot()`).
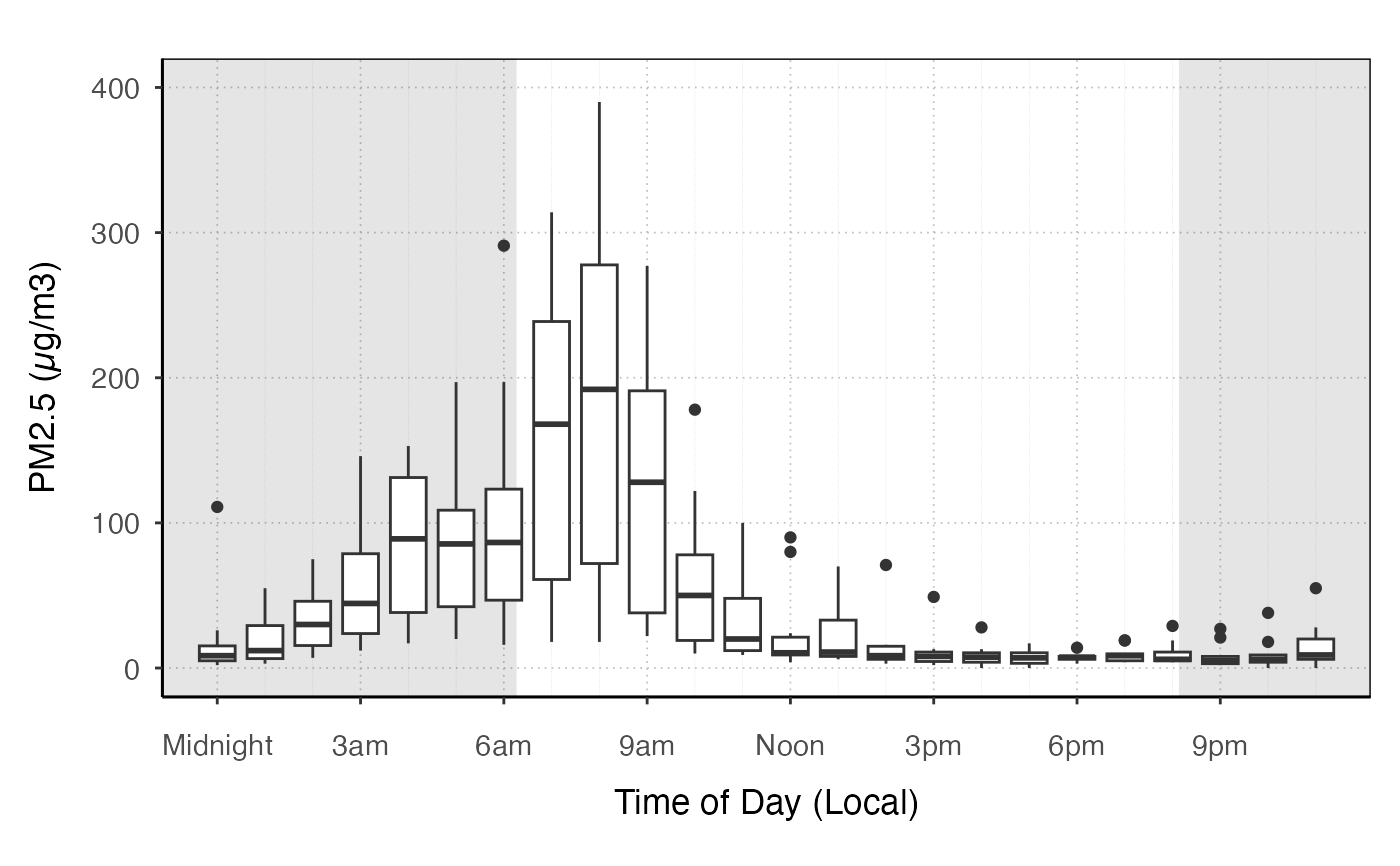
ggplot_pm25Diurnal(
monitor,
startdate = 20160801,
enddate = 20160810
) +
stat_boxplot(aes(group = hour))
#> Warning: Removed 7 rows containing non-finite outside the scale range
#> (`stat_boxplot()`).